
Concentration risk monitoring is the continuous process of identifying material pools of exposure, measuring them against an institution's risk bearing capacity, and triggering governance action when limits are approached. The core discipline runs in three steps: identify where exposure clusters by borrower, industry, geography or collateral type, measure that clustering against capital and net worth, and escalate when thresholds move. Start today by pulling your latest exposure aggregation, checking top exposures against board limits, and confirming the data behind both is current.
TL;DR:
- Monitoring thresholds should be set well below 25% of tier 1 capital for small institutions with limited capital buffers.
- Accurate exposure aggregation requires consolidating affiliated borrowers, updating industry codes, and including off-balance-sheet items regularly.
- Exceeding 100% of net worth in concentration metrics warrants careful monitoring and a documented board rationale.
- Stress testing scenarios should incorporate systemic shocks, second-order effects, and be paired with specific owners and remediation deadlines.
- Board-level dashboards need to highlight top exposures, trends, and stress test impacts with quarterly cadence for material concentrations.
Automate Regulatory Model Risk Governance
Examine models against 32 qualitative criteria and resolve risk Tiers with pre-deployment checklists per OCC 2011-12 guidelines.
Table of Contents
- Defining Concentration Risk: Name, Segment, and the Drivers Behind Both
- Building the Data Foundation to Spot Hidden Concentrations
- Measuring Concentration: Metrics That Tie Back to Capital
- Designing Stress Scenarios That Reveal What Static Metrics Miss
- Setting Policy: Limits, Escalation, and Independent Review
- Reporting Cadence, Dashboards, and the KPIs the Board Actually Needs
- Where Monitoring Programs Break Down in Practice
- Why Concentration Monitoring Belongs on the Board's Agenda, Not Just Compliance's
- How RiskInMind Supports Concentration Risk Monitoring
- FAQ
- Sources
Defining Concentration Risk: Name, Segment, and the Drivers Behind Both
Examiners and risk officers use two related but distinct terms. Name concentration refers to exposure to a single borrower or a group of connected borrowers whose fortunes rise and fall together, such as a parent company and its subsidiaries. Segment concentration refers to exposure clustered around a shared characteristic, which could be an industry, a geographic market, a collateral type or a funding source.
The revised Comptroller's Handbook booklet defines a concentration as the sum of direct, indirect or contingent obligations that exceeds 25% of a bank's tier 1 capital plus the allowance for credit losses, while explicitly scaling supervisory expectations to an institution's size and complexity. A community bank with a thin capital cushion and a lender with diversified wholesale funding will reasonably set internal triggers well below that line.
Common drivers of concentration show up repeatedly across portfolios:
- Industry concentration, where a disproportionate share of credit sits in one sector such as agriculture, hospitality or commercial real estate.
- Geographic concentration, where a regional economic shock could hit a large share of the book at once.
- Single counterparty or connected borrower group concentration, including affiliated entities that share repayment capacity.
- Funding and correspondent concentration, where reliance on a small number of wholesale funding sources or correspondent relationships creates fragility.
- Collateral crowding, where loans across unrelated borrowers are secured by the same asset class or even the same physical market.
None of these drivers is inherently a problem. The risk emerges when an institution cannot quantify how much of its capital base stands behind any one of them, which is precisely what monitoring is built to answer. For a broader view of how concentration fits alongside other exposure categories, see our overview of financial institution risk types.
Building the Data Foundation to Spot Hidden Concentrations
Concentration only becomes visible when the underlying data can be aggregated correctly, and most monitoring failures trace back to this step rather than to the math that follows. A risk team needs a defined set of data elements before any metric means anything.
- Borrower and connected-group identifiers, so that affiliated entities are rolled up rather than counted as independent exposures.
- Industry and NAICS or SIC codes at the loan level, refreshed as a borrower's business changes rather than fixed at origination.
- Collateral type and current valuation history, not just the appraisal on file at closing.
- Participation and off-balance-sheet exposure records, including unfunded commitments and letters of credit.
- Geographic location of both the borrower and the underlying collateral, which can diverge for commercial real estate and agricultural credits.
Aggregation rules matter as much as the raw fields. Affiliated borrowers need to be consolidated under a single connected-group total, off-balance exposures need to be folded into gross figures rather than left in a side ledger, and participations sold or purchased need consistent treatment so an institution does not understate what it has actually retained. NCUA guidance on managing concentration risk specifically calls for comprehensive data warehousing and periodic reporting built on this kind of consolidated view, a theme echoed across supervisory commentary on management information systems.
The practical pitfalls are familiar to anyone who has tried to pull a true exposure report under deadline. Stale credit scores sit in the file for years past the last refresh. Loan, deposit and collateral data live in siloed product systems that were never built to talk to each other. Borrower linkage logic is ambiguous, so a guarantor's other obligations slip through unseen. Fixing these issues is largely a data governance exercise, covered in more depth in our guide to real-time risk data governance.

Pro Tip: Run a quarterly reconciliation between your loan origination system, core, and collateral management platform before each concentration report goes to the board, not after.
Measuring Concentration: Metrics That Tie Back to Capital
Once the data is trustworthy, measurement becomes a matter of choosing metrics that map cleanly to capital and net worth rather than sitting in isolation. Several approaches work well together rather than as substitutes for one another.
- Percent of tier 1 capital for each major concentration, calculated against the same 25% reference point the Comptroller's Handbook uses, adjusted to the institution's own risk appetite.
- Percent of net worth, which NCUA guidance treats as a critical gauge for credit unions, with concentrations exceeding net worth at levels that require careful monitoring and a documented board rationale if undertaken under NCUA's guidance.
- Top-N exposure reporting, ranking the ten or twenty largest connected-borrower exposures regardless of industry classification.
- A Herfindahl-style concentration index adapted to loan portfolios, which captures how unevenly exposure is distributed across segments rather than just flagging the single largest one.
NCUA guidance states that concentrations exceeding 100% of net worth require careful monitoring and a documented board rationale if undertaken, a threshold that turns a measurement exercise into a governance decision the moment it is crossed.
Translating these metrics into potential loss scenarios means asking what happens to the allowance for credit losses and to regulatory capital if a given concentration migrates to default at a stressed rate. The Comptroller's Handbook notes that examiners expect capital levels substantially above regulatory minimums at institutions carrying significant concentrations, which means the measurement work feeds directly into capital planning rather than sitting as a standalone risk report. Calibration should scale with complexity: a single-market community bank may track five or six concentration categories meaningfully, while a multi-state lender needs a far more granular segmentation. Whatever model or index a team builds, document its assumptions and limitations explicitly, because an unexamined model is often where the next blind spot hides.
Designing Stress Scenarios That Reveal What Static Metrics Miss
Static concentration metrics tell you where exposure sits today. Stress testing tells you what happens to that exposure when conditions change, and it routinely surfaces concentrations that a percent-of-capital calculation never flags because the correlation only appears under pressure.
Useful scenario types include a sector-specific downturn applied to the largest industry concentration, a regional economic shock layered onto geographic exposure, a systemic funding stress scenario that tests reliance on wholesale or correspondent sources, and a correlated collateral decline that hits multiple unrelated borrowers secured by the same asset class simultaneously.
- Start with idiosyncratic shocks tied to a single large borrower or connected group, then layer in systemic shocks that hit an entire sector or region at once.
- Build in second-order effects, such as a regional shock that triggers deposit outflows at the same institution carrying the concentrated loan exposure.
- Run scenarios at a frequency tied to materiality, with quarterly testing as a baseline for material concentrations and more frequent runs for exposures that move quickly, such as construction or agricultural lending tied to commodity prices.
Interagency guidance on counterparty credit risk management calls for enterprise-wide processes that identify, quantify, monitor and control concentrated exposures, paired with integrated stress testing rather than testing conducted in a silo. Stress testing guidance from the Federal Reserve similarly emphasizes that tests should probe correlated drivers and second-order effects, since these are precisely what standard aggregation metrics miss. The output of a stress run should do more than populate a report: it should trigger a review of existing limits, inform whether a capital buffer needs adjustment, and start a remediation conversation before the scenario becomes reality. Our guide to portfolio stress testing for community banks walks through scenario construction in more detail.
Pro Tip: Pair every stress scenario with a named owner and a 30-day remediation checkpoint, so results do not sit in a report that nobody acts on.
Setting Policy: Limits, Escalation, and Independent Review
A concentration risk policy earns its place in the risk framework only when it converts measurement into enforceable action. Several elements belong in that policy document regardless of institution size.
- Clear definitions of name and segment concentration, matched to the categories the institution actually tracks.
- A limit framework with board-approved thresholds for each major concentration category, reviewed at least annually.
- Escalation triggers specifying who is notified, within what timeframe, when a limit is approached or breached.
- Remediation timelines that tie corrective action to a specific calendar rather than an open-ended commitment.
- Documentation requirements capturing the rationale whenever a concentration above policy is knowingly carried.
Independent validation matters as much as the policy language itself. Internal audit or a model risk function should periodically test whether the aggregation logic, the metrics and the stress assumptions hold up, rather than leaving that review to the same team that built the monitoring process. The Comptroller's Handbook ties concentration risk management directly to examiner ratings on capital, asset quality and management, which means a weak policy does not just invite a finding, it can move a composite rating. Limits should never sit apart from the institution's broader risk appetite statement, since a concentration ceiling that contradicts the board's stated appetite for capital and liquidity creates exactly the kind of inconsistency examiners are trained to spot. Our governance guide for risk committees and our breakdown of risk appetite frameworks both offer policy language worth adapting.
Reporting Cadence, Dashboards, and the KPIs the Board Actually Needs
A concentration risk report earns attention only if it tells the board something actionable, which means the dashboard design and reporting frequency deserve as much thought as the underlying metrics.
- Top exposures by percent of capital, updated against the current limit framework rather than last quarter's figures.
- Concentration by driver, showing industry, geography and collateral type side by side so trends across categories are visible at a glance.
- Credit score and risk rating migration within concentrated segments, which often moves before delinquency does.
- Stress test deltas, showing how each major concentration's loss estimate shifted from the prior test cycle.
NCUA guidance recommends quarterly reporting for larger portfolios carrying material concentrations, with more frequent reporting warranted for exposures that move quickly. A board summary works best when it pairs each metric with a short trend narrative and a recommended action rather than a bare number.
| Reporting element | Recommended cadence | Primary audience |
|---|---|---|
| Top-N exposure and limit status | Quarterly | Board risk committee |
| Stress test results and deltas | Quarterly, or monthly for volatile segments | Board and senior management |
| Concentration by industry and geography | Quarterly | Risk committee and examiners |
| Data quality and reconciliation checks | Monthly | Risk and operations teams |
Executive dashboards work best built around a handful of widgets rather than a dense grid of numbers: a limit utilization gauge for each major concentration, a trend line for the largest segment over the past eight quarters, and a flag list for any exposure approaching its threshold. Our credit risk dashboard guide lays out widget examples built for exactly this purpose.
Where Monitoring Programs Break Down in Practice
Most concentration monitoring failures are not analytical, they are operational. Data lag and stale inputs sit at the top of the list: a credit score that has not refreshed in eighteen months or a collateral valuation carried at origination value will understate a concentration long before anyone notices. Correcting these issues matters more, and comes first, than building a more sophisticated model on top of flawed inputs.
A sound prioritization sequence looks like this:
- Fix data governance and borrower consolidation rules before anything else, since every downstream metric depends on them.
- Confirm exposure aggregation captures off-balance-sheet items, not just funded balances.
- Automate dashboarding for top exposures so the board sees current numbers rather than a quarter-old snapshot.
- Layer in stress-testing overlays and a documented remediation playbook once the first three are solid.
Platforms built for financial institutions increasingly automate pieces of this sequence. A leading AI-powered risk management platform for financial institutions runs on specialized AI agents, including a regulatory compliance agent and a credit risk assessment agent, coordinated by a central AI director. The platform is designed with SOC 2® aligned controls and processes data in real time, with response times under half a second, characteristics that matter directly for the data-freshness problems described above.
Why Concentration Monitoring Belongs on the Board's Agenda, Not Just Compliance's
Concentration monitoring too often gets treated as a periodic compliance filing rather than what it actually is: a live input into how much risk a board is willing to carry. A dashboard that flags a limit breach six weeks after the fact has already failed its purpose, regardless of how accurate the underlying math turns out to be. The institutions that get this right treat the quarterly report, the stress test and the MIS refresh as one connected process, not three separate deliverables assembled by three different teams on three different schedules.
Capital does not just absorb risk, it decides where risk goes, and a board that cannot see its concentrations clearly is making that allocation decision blind. The practical fixes outlined here, from data consolidation to board-level dashboards, are not a compliance checklist. They are the mechanism by which a board actually exercises the risk appetite it claims to have.
— Raj
How RiskInMind Supports Concentration Risk Monitoring
Fixing the data lag and manual aggregation problems described above does not require a bigger risk team, it requires a platform that keeps the exposure picture current without someone rebuilding a spreadsheet every quarter. RiskInMind is built specifically for credit unions, community banks and lenders that need concentration monitoring tied directly into their broader risk workflow rather than bolted on as a side process.
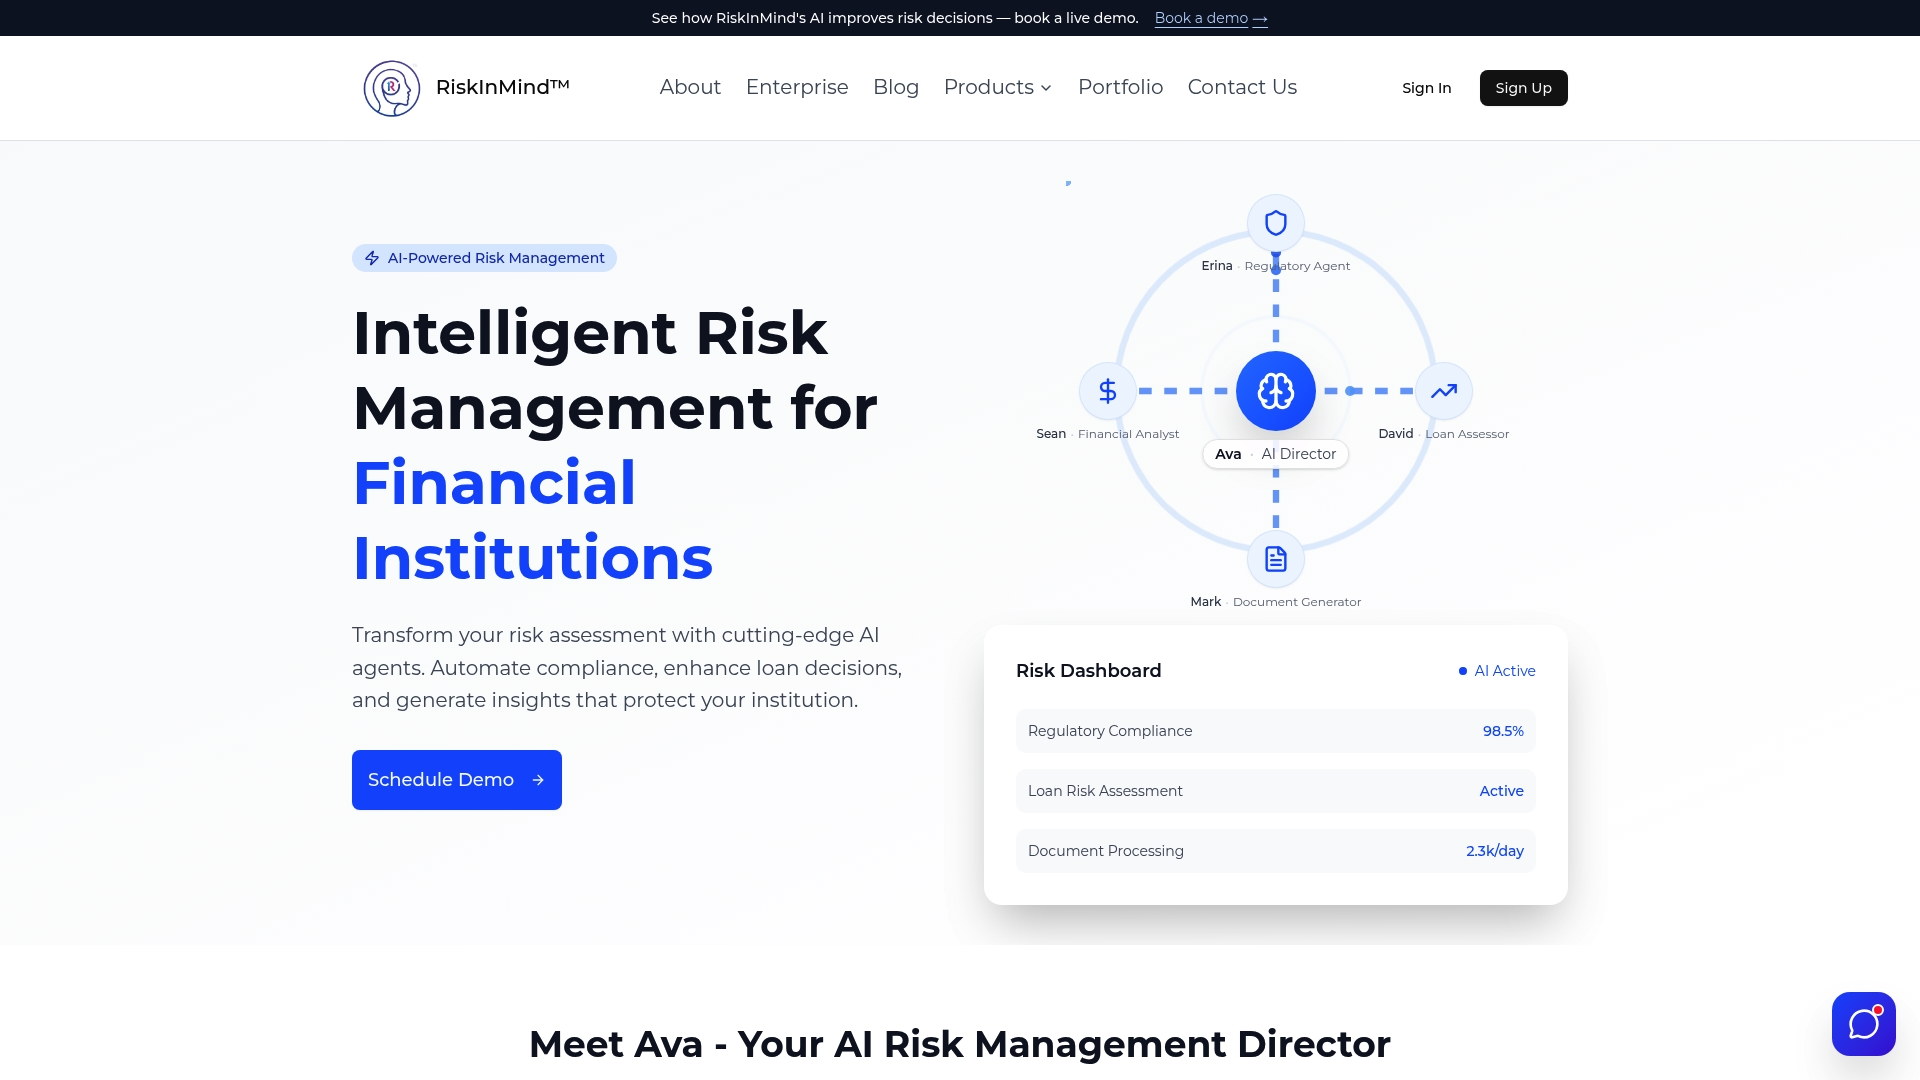
- Specialized AI agents work under a central AI director to keep portfolio monitoring and compliance reporting connected.
- Real-time processing with rapid response times means exposure dashboards reflect the current book, not last month's extract.
- SOC 2® aligned controls and strong security support the audit trail examiners expect to see behind concentration reporting.
- The platform's portfolio and benchmarking tools help teams compare concentration levels against automated regulatory reporting output rather than reconciling them by hand.
Teams ready to see how this fits an existing concentration monitoring process can review plan options on the RiskInMind pricing page.
FAQ
What are the Basel III pillars?
Basel III is organized around three pillars: minimum capital requirements, supervisory review of an institution's own risk assessment, and market discipline through public disclosure. Concentration risk monitoring feeds primarily into the first two pillars, since concentrated exposures affect required capital levels and are a direct focus of supervisory review under guidance such as the Comptroller's Handbook.
What is considered a concentration risk?
A concentration risk exists when exposure to a single borrower, connected group, industry, geography or collateral type is large enough relative to capital or net worth that its deterioration could threaten the institution's financial condition. The OCC's revised Concentrations of Credit booklet frames this as obligations exceeding 25% of tier 1 capital plus the allowance for credit losses, though institutions commonly set tighter internal thresholds.
How do you manage concentration risk?
Managing concentration risk starts with accurate identification through consolidated data and aggregation rules, followed by measurement against capital and net worth, stress testing to uncover hidden correlations, and board-approved limits with clear escalation triggers. NCUA guidance calls for this to run as a continuous cycle of identify, measure, monitor and control, backed by comprehensive data warehousing and periodic reporting.
What are the three C's used to measure borrower risk?
Borrower risk assessment commonly references character, capacity and collateral, sometimes extended with capital and conditions in a five-C framework. These factors inform underwriting decisions at the individual borrower level, which then feed into the aggregated data a concentration monitoring program relies on to spot clustering across the portfolio.
Sources
- Concentrations of Credit: Revised Comptroller’s Handbook Booklet and Rescissions | OCC
- Managing Concentration Risk in Credit Unions
- Interagency Supervisory Guidance on Counterparty Credit Risk Management