
Tail risk is the exposure a portfolio carries to rare, extreme losses that fall in the far left tail of a return distribution, beyond what standard models expect. The immediate implication: these events, while infrequent, can produce drawdowns severe enough to derail a fund's or an institution's long-term objectives in a matter of days. Financial professionals manage that exposure through a handful of proven approaches.
- Diversify beyond correlation assumptions by holding assets that behave differently when stress hits, not just historically.
- Layer in explicit hedges, such as equity puts or volatility exposures, sized to a defined risk budget.
- Build permanent, structural protection rather than scrambling for coverage once volatility has already spiked.
Key Takeaways
Automate Regulatory Model Risk Governance
Examine models against 32 qualitative criteria and resolve risk Tiers with pre-deployment checklists per OCC 2011-12 guidelines.
Tail risk management works best when hedges are sized against a fixed risk budget and embedded structurally, not purchased reactively during a crisis.
| Point | Details |
|---|---|
| Tail risk defined | Extreme, rare losses beyond roughly three standard deviations that standard models underestimate. |
| Fat tails are real | Excess kurtosis means extreme moves happen more often than a normal distribution predicts. |
| Measure with VaR and CVaR | CVaR captures average loss beyond the VaR threshold, giving a fuller picture of severity. |
| Diversify hedging methods | Multi-strategy frameworks reduce the performance drag of relying on a single hedge type. |
| Monitor continuously | Riskinmind's real-time platform tracks correlation and volatility shifts to support structural, always-on hedging programs. |
Table of Contents
- What Is Tail Risk in Finance and Why Does It Matter?
- Why Do Standard Risk Models Understate Tail Risk?
- How Do You Measure Tail Risk?
- What Do Historical Tail Events Teach Investors?
- What Are the Best Tail Risk Management Strategies?
- How Should You Implement and Govern a Tail-Risk Program?
- How Does AI Improve Tail-Risk Monitoring?
- What Should Risk Teams Actually Do About Tail Risk?
- Put Tail-Risk Monitoring on Autopilot
- Frequently Asked Questions
- Sources
What Is Tail Risk in Finance and Why Does It Matter?
Every return distribution has "tails," the outer edges representing the most extreme gains and losses. In a normal distribution, those tails thin out fast: a three standard deviation move should be vanishingly rare. Real markets don't cooperate. Returns exhibit "fat tails," meaning extreme outcomes cluster far more often than a bell curve predicts, a pattern well documented across decades of empirical finance research.
Two statistics capture this. Skew measures asymmetry, whether losses or gains dominate the extremes. Kurtosis measures how fat those tails actually are relative to a normal curve; excess kurtosis signals more frequent extreme moves than the Gaussian model assumes.
SoFi's explainer on tail risk frames the convention directly: a tail event typically means a return more than three standard deviations from the mean, though the CBOE's SKEW index and similar frameworks sometimes use a two standard deviation threshold instead.
- A 3-sigma event: rare under normal assumptions, common enough in practice to matter.
- A 2-sigma threshold: catches more events, useful for earlier warning systems.
Statistic: Systemic shocks that spike correlations and break diversification have historically recurred roughly every three to five years, far more frequently than a normal-distribution model would suggest.
Why Do Standard Risk Models Understate Tail Risk?
Most conventional risk models lean on assumptions that hold in calm markets and collapse in stressed ones. That gap is where tail risk does its damage.
- Normality assumptions underweight how often extreme moves actually happen.
- Stable correlation assumptions ignore that assets tend to move together precisely when you need them not to.
- Constant liquidity assumptions fail when bid-ask spreads widen and buyers vanish.
During a genuine crisis, volatility spikes, correlations across asset classes rise together, and options that were cheap suddenly reprice at a premium. Investopedia's overview notes that diversification, the standard defense against ordinary risk, becomes far less effective exactly when correlations converge under stress.
This creates a path-dependency problem: hedges you didn't already own become expensive or unavailable the moment you need them, since volatility and option costs spike in tandem with the crisis itself. Just-in-time hedging is a myth institutions learn the hard way.
How Do You Measure Tail Risk?
Two measures dominate practitioner conversations. Value at Risk (VaR) estimates the maximum expected loss at a given confidence level over a set period, but it says nothing about how bad things get beyond that threshold. Conditional Value at Risk (CVaR), also called expected shortfall, fills that gap by averaging the losses that occur once you've breached the VaR line. CVaR is generally preferred for tail severity, while VaR remains useful as a threshold marker.
Neither measure works in isolation. Combine them with stress tests and scenario analysis, applied on a recurring schedule, not just once a year.
| Metric | What it tracks | Best used for |
|---|---|---|
| VaR | Loss threshold at a confidence level | Setting risk limits |
| CVaR / Expected Shortfall | Average loss beyond the VaR threshold | Sizing tail exposure |
| Realized/conditional volatility | Current market turbulence | Early warning signals |
| Correlation matrices | Co-movement across assets | Detecting diversification breakdown |
| VIX / SKEW indices | Market-implied fear and tail pricing | Gauging hedge cost and demand |
- Run VaR and CVaR calculations at least weekly; daily during volatile stretches.
- Refresh correlation matrices monthly, and immediately after any market shock.
- Pair every statistical read with a qualitative stress scenario, not just a number.
What Do Historical Tail Events Teach Investors?
Theory only goes so far. History shows how tail risk actually unfolds.
- Black Monday, 1987: program trading and portfolio insurance amplified a single-day crash; correlations across nearly every equity market spiked simultaneously, and diversification offered almost no protection.
- LTCM, 1998: a highly leveraged hedge fund's model assumed stable spreads; a Russian default broke that assumption, and forced liquidations froze credit markets.
- Global financial crisis, 2008: mortgage-linked assets that appeared uncorrelated moved together once liquidity evaporated, illustrating why diversification can break down exactly when it's needed most.
- March 2020, COVID crash: even government bonds sold off alongside equities for several days as investors scrambled for cash, a rare correlation flip that caught many risk models flat-footed.
The takeaway repeats across all four: diversification assumptions built on calm-market correlations fail under stress, and hedges purchased in advance behave very differently from hedges you try to buy mid-crisis.
What Are the Best Tail Risk Management Strategies?
No single instrument solves tail risk. Practitioners typically draw from several categories, weighing cost against reliability.
- Outright puts and options. Direct downside protection on equities or indices, but carries an ongoing premium cost that erodes returns in calm years.
- Volatility exposures (VIX-linked strategies). Tends to spike exactly when equities fall, offering strong convexity, though roll costs and tracking error make it operationally tricky.
- Trend-following strategies. Historically performs well in sustained downturns since it can go short, but lags in choppy, range-bound markets.
- Credit protection (CDS or credit puts). Useful for portfolios with heavy credit exposure, though liquidity in stressed credit markets can be thin.
- Portfolio tilts toward defensive sectors or lower-volatility assets. Low ongoing cost and simple to implement, but offers only partial, imprecise protection.
- Interest rate and currency options. Relevant for multi-asset portfolios exposed to macro shocks, with costs that vary by regime.
Goldman Sachs Asset Management's research reframes the sizing question: a hedge's value comes less from its standalone payoff and more from how much additional core risk it lets you responsibly carry.
T. Rowe Price's research makes a related point: leaning on a single strategy, especially repeated option buying, tends to create steady performance drag. A diversified, multi-strategy framework spreads that cost across approaches that perform differently depending on which kind of tail event actually shows up.
Pro Tip: Treat your tail-risk allocation as a fixed line item in the risk budget, sized as a percentage of the portfolio, rather than an opportunistic trade you add or remove based on how nervous the market feels.
How Should You Implement and Govern a Tail-Risk Program?
Turning strategy into practice starts with governance, not instruments.
- Define the target tail event you're protecting against (equity crash, credit spread blowout, rate shock).
- Set allowed instruments, counterparty limits, and reporting frequency before deploying capital.
- Pilot a strategy at small size, measure its behavior in a real drawdown, then scale.
- Build sizing and rebalancing rules tied to a fixed risk budget, not market sentiment.
- Stand up dashboards and alerts that flag correlation spikes and volatility regime shifts in real time.
- Hedge drag is the recurring cost of protection during calm markets; quantify it annually and present it to stakeholders as insurance premium, not wasted spend.
- Timing risk means a hedge deployed too early or too late underperforms; permanent programs reduce this exposure versus reactive ones.
- Model risk creeps in when the tools measuring tail exposure carry their own blind spots. Our guide to model risk management covers how to build controls around that.
- Counterparty risk matters most for OTC hedges; our third-party risk management guide covers how to set exposure limits.
How Does AI Improve Tail-Risk Monitoring?
Static spreadsheets can't keep pace with correlations that shift by the hour during stress. Real-time platforms close that gap with continuous, automated surveillance rather than periodic snapshots.
- Real-time correlation and volatility heatmaps that flag regime shifts as they develop.
- Automated scenario generation that stress-tests a portfolio against dozens of historical and hypothetical tail events at once.
- Option-hedge simulators that model reliability and cost before capital moves.
- Backtest replay tools that show how a proposed hedge would have performed in 1987, 2008, or March 2020.
Riskinmind's platform runs on SOC 2® certified, bank-grade infrastructure with sub-half-second processing, built for institutions that can't afford stale risk data during a fast-moving market.
Pro Tip: Automation replaces the "just-in-time" hedging trap. A continuous, embedded protection program checked constantly by AI agents is far more likely to be in place, and reasonably priced, when the shock actually arrives.

What Should Risk Teams Actually Do About Tail Risk?
Most teams treat tail-risk hedging as a one-off insurance purchase after a scare. That's backward. The stronger approach embeds protection structurally into the portfolio from the start, sized as a permanent allocation rather than a reaction to headlines.
Hedges aren't a substitute for sound portfolio construction. Their real value is letting you hold more core risk with confidence, not replacing the diversification work you should already be doing. During stress, watch correlation shifts in real time. That's the earliest signal a model's assumptions are breaking down.
Put Tail-Risk Monitoring on Autopilot
Building a tail-risk program by hand, spreadsheets, manual stress tests, quarterly reviews, means you're often reacting to a shock after the correlations have already flipped. Riskinmind replaces that lag with continuous, automated monitoring built specifically for financial institutions.
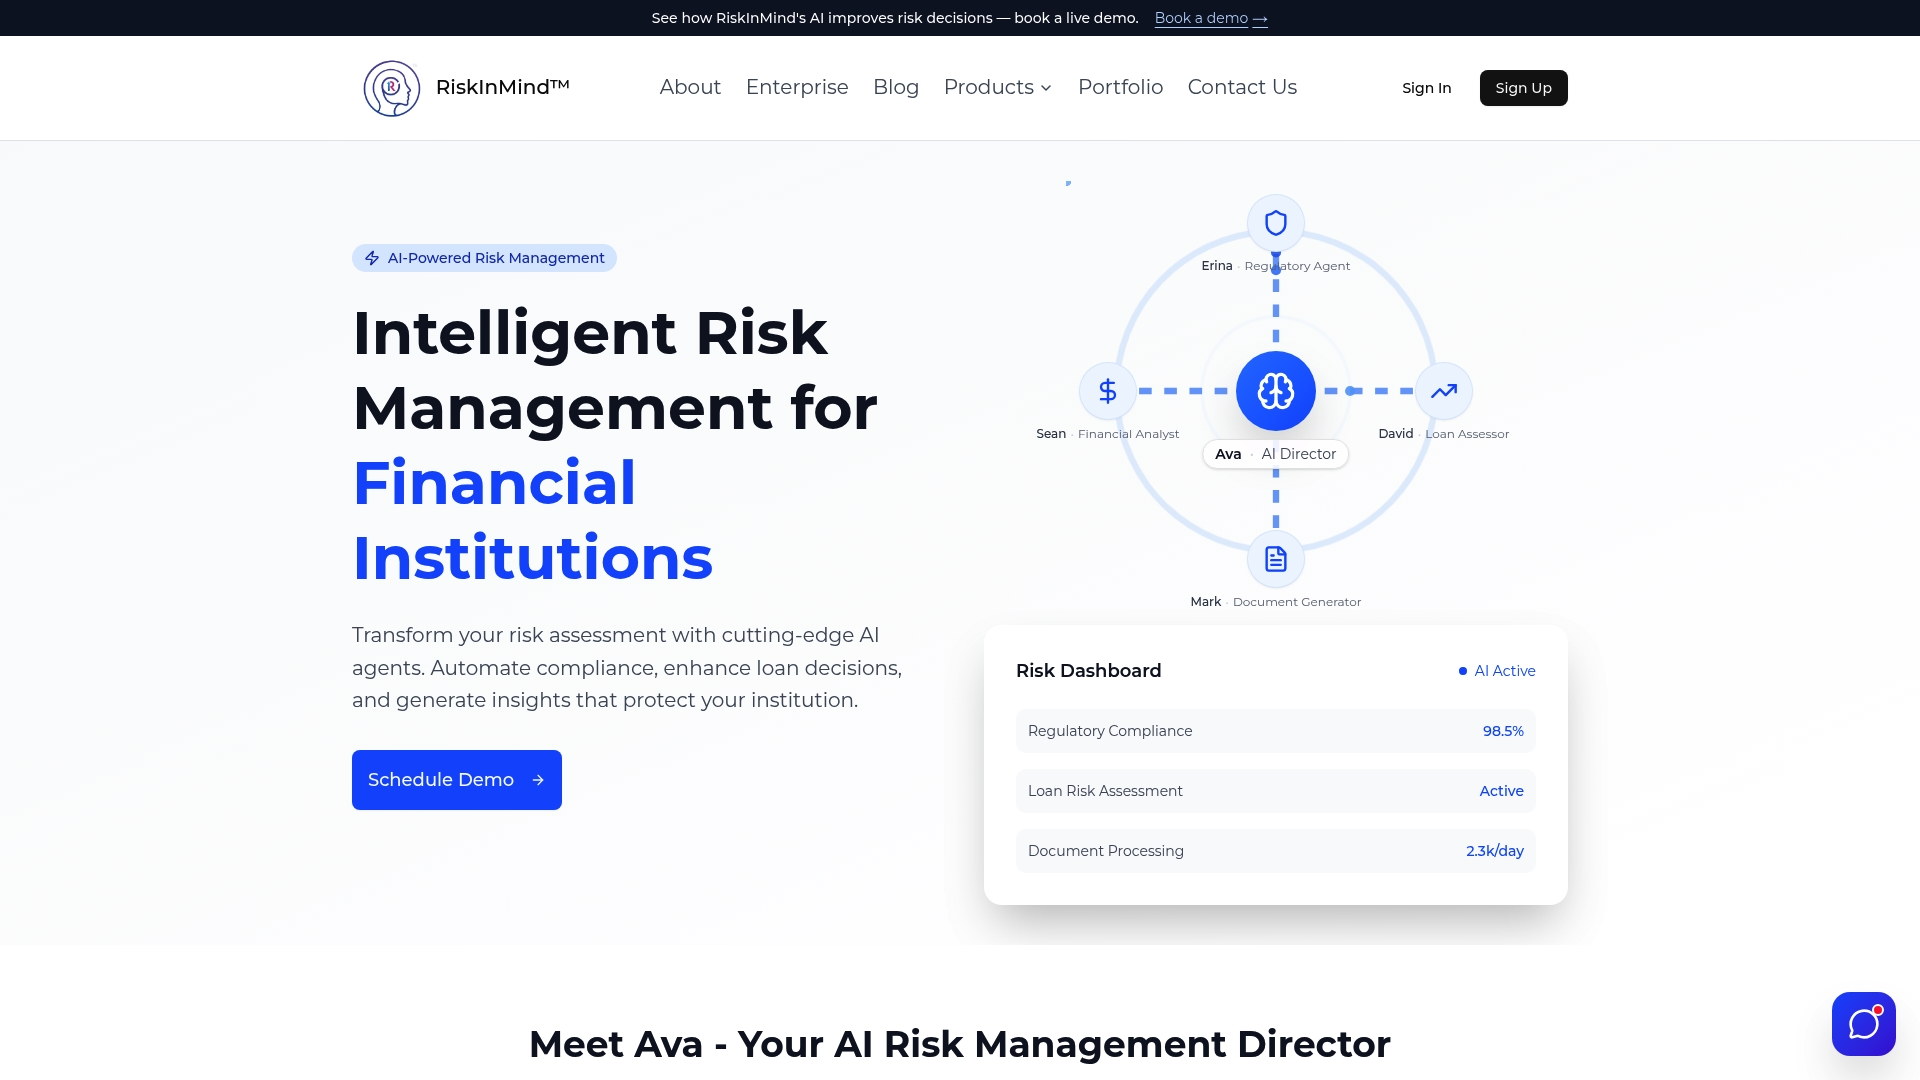
The platform's peer benchmarking and risk analysis tools let you see how your tail exposure compares against similar institutions, not just against your own history. For portfolio managers, the AI solutions built for portfolio oversight bring correlation heatmaps and scenario alerts directly into daily workflows. If you're still sizing your risk budget, the risk appetite framework calculator is a practical starting point to define how much tail exposure your institution can actually absorb. Try the calculator today to see where your current allocation stands.
Frequently Asked Questions
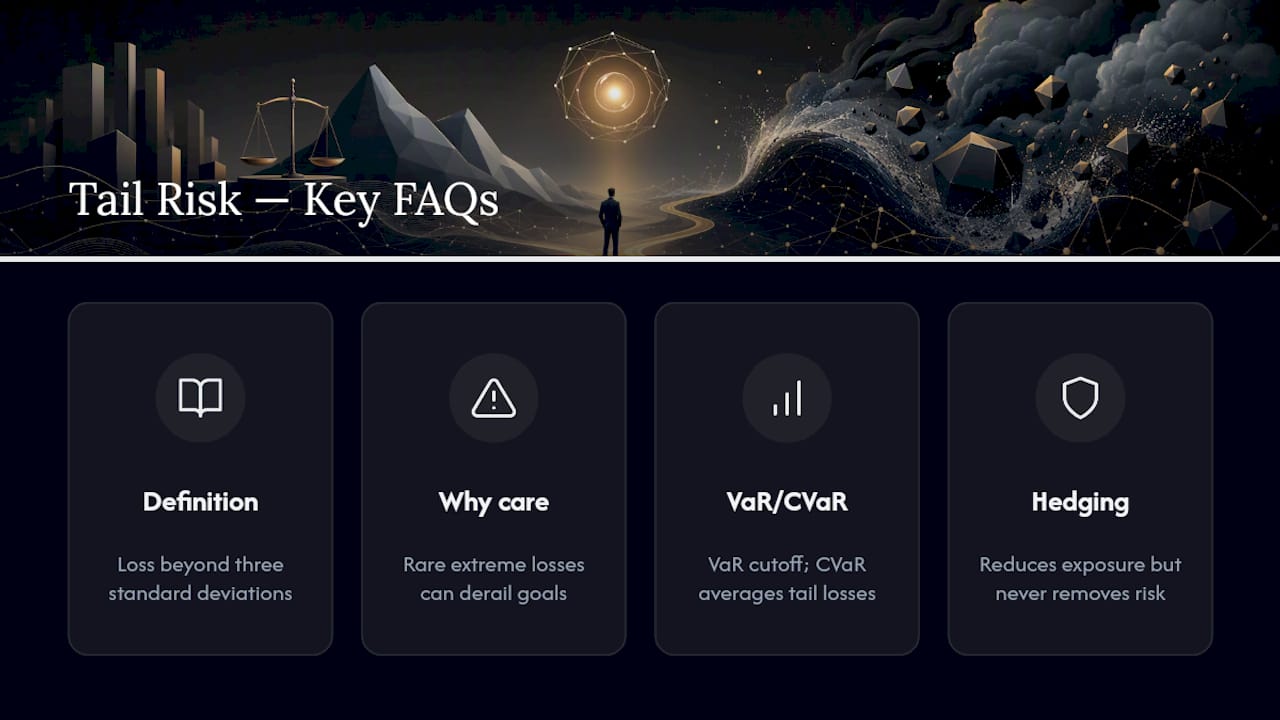
What is tail risk in finance, in simple terms? Tail risk is the chance of an extreme, rare loss that standard risk models understate, typically defined as a move beyond three standard deviations from the mean.
Why is tail risk important for investors? Because tail events, while infrequent, can produce losses severe enough to derail long-term goals, and normal diversification often fails right when correlations spike during a crisis.
What's the difference between VaR and CVaR? VaR estimates the maximum expected loss at a confidence level, while CVaR (expected shortfall) averages the losses that occur once that threshold is breached, making it more useful for gauging tail severity.
Can tail risk be fully eliminated? No. Hedging reduces exposure and can enable higher core risk allocation, but it comes with ongoing costs and never removes tail risk entirely.
This article is general information, not a substitute for advice from a qualified financial advisor. Consult a qualified financial professional about your own circumstances before acting on anything here.
Sources
- Tail risk explained
- Finding true value of tail-risk hedging
- A diversified approach to tail-risk mitigation (T. Rowe Price)
- Tail risk — Investopedia