
Portfolio early warnings are behavioral and financial signals, such as decision velocity, payment timing, or margin drift, that flag distress months before it shows up in quarterly numbers. The correct posture is not to wait for confirmation: establish a baseline for each signal, set watch, warn, and alert thresholds, and route every breach to a named owner within a defined response window. Frameworks like EY's AI-enabled early warning model and RiskInMind's monitoring agents both operate on this same logic: detect early, verify fast, act proportionally.
TL;DR:
- Behavioral signals such as declining communication, decision slowdown, and talent erosion lead financial distress by capturing real-time internal dynamics.
- Pattern detection, including multi-signal combinations like scaling crises or revenue cliffs, improves accuracy and reduces false positives compared to single-flag alerts.
- Building a robust early-warning system requires establishing baseline data, calibrated thresholds, tiered alert logic, and a clear response cadence with designated owners.
- AI-driven monitoring enables continuous detection of risk signals ahead of quarterly reports, allowing faster intervention and more effective portfolio management.
- Effective alerts depend on proper governance, including validated models, documented thresholds, and timely escalation protocols; over-alerting and slow routing undermine system value.
Automate Regulatory Model Risk Governance
Examine models against 32 qualitative criteria and resolve risk Tiers with pre-deployment checklists per OCC 2011-12 guidelines.
Table of Contents
- Core Early-Warning Signal Categories You Should Be Tracking
- How to Operationalize Early Warnings: Baselines, Thresholds, and Cadence
- What Does a 25-Indicator Diagnostic Score Actually Mean?
- Signal-to-Action Workflow: Triage, Investigation, and Routing
- How AI Changes Early-Warning Detection
- How Economic Conditions Reshape Early-Warning Signals
- Fitting Early Warnings Into Your Broader Risk Framework
- Prioritizing and Escalating Warnings by Severity
- Where Early-Warning Systems Go Wrong
- How RiskInMind Supports Early-Warning Monitoring
- Sources
- FAQ
Core Early-Warning Signal Categories You Should Be Tracking
Most credit teams still lean almost entirely on financial ratios, and that habit is exactly why so many early warnings arrive late. Financial statements are backward-looking by design. A borrower's cash position on a balance sheet reflects decisions made two or three months earlier. Behavioral signals, by contrast, capture what's happening inside the business right now, and they consistently lead financial deterioration by a meaningful margin.
Behavioral signals
Zoe Diagnostics identifies six behavioral indicators that reliably precede financial distress in portfolio companies, and each one maps cleanly onto data credit teams can actually observe:
- Communication volume decline — a borrower or portfolio company that used to respond within a day starts taking a week, or stops initiating contact altogether.
- Decision velocity slowdown — approvals, sign offs, and strategic calls that once moved in days start stalling for weeks.
- Execution cycle time expansion — projects, product launches, or fulfillment cycles that quietly stretch beyond historical norms.
- Key-person centralization — decision authority collapses into one or two individuals, a classic precursor to succession or leadership crises.
- Meeting load escalation — a sudden spike in internal meetings often signals firefighting rather than growth.
- Talent engagement erosion — rising voluntary turnover among senior staff, particularly in finance or operations roles.
None of these show up on a balance sheet, and none of them require waiting for a quarterly close to observe.
Financial and operational signals
The financial side still matters, but the signals worth watching are the leading operational ones, not the lagging accounting ones. Vendor payment velocity is one of the sharpest: a company that starts stretching payment terms from 30 to 45 or 60 days is telling you something about liquidity before it ever shows up in a covenant breach. Days sales outstanding (DSO) creeping upward, accounts receivable aging shifting toward the 90-plus bucket, gross margin compression that doesn't match a stated pricing strategy, and a thinning sales pipeline relative to historical conversion rates all belong on the same dashboard.
Why pattern detection beats single-signal triggers
A single yellow flag rarely means much on its own. Payment terms slip for all kinds of benign reasons, seasonality among them. The value comes from watching combinations. Zoe Diagnostics describes recognizable multi-signal patterns worth building alert logic around:
- Scaling crisis — rapid revenue growth paired with decision velocity slowdown and meeting load escalation, a sign operations haven't caught up with growth.
- Burnout cascade — talent engagement erosion combined with key-person centralization, often the earliest tell of a leadership team running on fumes.
- Revenue cliff — communication decline paired with pipeline thinning, frequently the first visible trace of a major client walking away quietly.
Pattern-based detection cuts false positives dramatically compared to single-threshold alerts, because it requires corroboration across independent data streams before a signal escalates.
How to Operationalize Early Warnings: Baselines, Thresholds, and Cadence
Signals are only useful if they're measured consistently against a real baseline, not a guess. Building that infrastructure takes four deliberate steps.
1. Identify and connect your data sources. Payment systems and accounts payable feeds capture vendor payment velocity and DSO drift. CRM systems surface pipeline health and deal-stage stalling. Helpdesk and support ticket volume can reveal customer dissatisfaction before churn hits the books. HR systems track turnover and hiring freezes. Telemetry from operational software (shipment tracking, production systems, usage analytics) rounds out the operational picture. Each connector needs a data governance owner and a clear refresh schedule, since stale feeds produce false confidence.
2. Establish a real baseline before setting any threshold. Measure each signal over an initial period, typically two to four quarters where data allows, to capture seasonal variation. Normalize by company size, sector, and growth stage. Use rolling windows (trailing 90 days is common) rather than static year-over-year comparisons, since rolling windows adapt faster to genuine shifts in trajectory.
3. Build threshold logic in three tiers, not one. A template structure looks like this:
- Monitor — signal has moved beyond one standard deviation from baseline; no action needed, just continued tracking.
- Warn — signal has moved beyond a defined secondary threshold, or two related signals have crossed monitor level simultaneously; triggers a scheduled check-in.
- Alert — signal has breached a severe threshold, or a recognized multi-signal pattern has formed; triggers immediate investigation.
Exact numeric thresholds should be calibrated per portfolio segment rather than copied wholesale from another institution's book, since risk appetite and typical borrower behavior vary too much to standardize blindly.
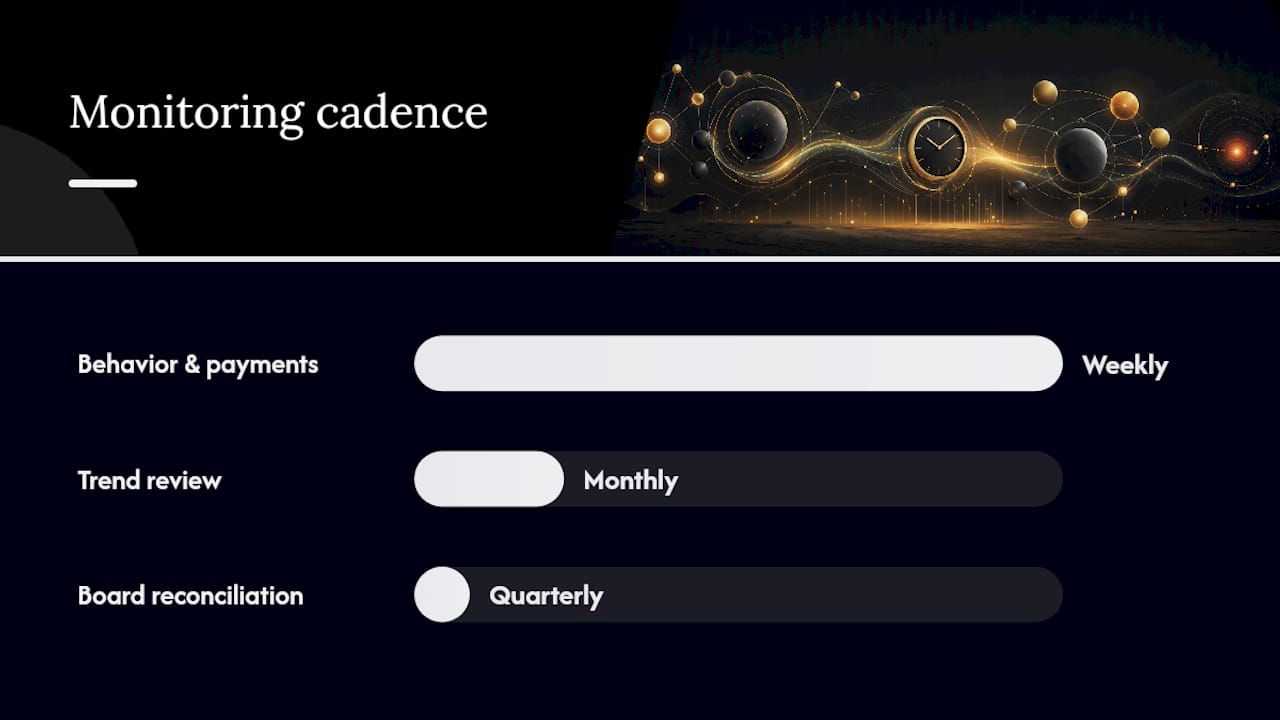
4. Set a monitoring cadence that fills the gap between board cycles. Continuous or weekly monitoring for behavioral and payment signals, monthly aggregation for trend review, and quarterly reconciliation with board and committee reporting. Sopact's research on real-time portfolio monitoring makes the point directly: a threshold that isn't routed to a specific owner just becomes a buried metric nobody acts on.
Pro Tip: Don't build thresholds off industry averages alone. Pull each borrower's own trailing 12-month behavior as the baseline, then measure deviation from that. A company with historically slow payment terms and one that just started stretching them are sending very different signals, even if their current DSO numbers look identical.
Reviewing operational risk indicator types alongside this cadence helps standardize what "material deviation" actually means across a diverse loan book.
What Does a 25-Indicator Diagnostic Score Actually Mean?
A scoring framework turns scattered observations into a single number a credit committee can act on, and it removes the subjectivity that creeps into gut-feel risk calls. A Faster Exit's 25-indicator diagnostic organizes indicators into five domains, each carrying five metrics:
- Cash — runway, burn rate trend, cash conversion cycle, covenant headroom, deposit concentration.
- Working capital — DSO trend, AP stretch, inventory turns (where applicable), factoring or discounting usage, working capital ratio movement.
- Operations — execution cycle time, vendor reliability, key-person dependency, capacity utilization, incident or exception rate.
- Revenue — pipeline coverage ratio, customer concentration, churn rate trend, average deal size trend, win rate movement.
- People — voluntary turnover in finance/ops, engagement survey trend (where available), leadership stability, hiring freeze status, meeting load index.
Scoring and action bands
Each of the 25 indicators gets scored 0, 1, or 2, where 0 means within normal range, 1 means moderate deviation, and 2 means severe deviation. Scores aggregate into a total out of 50, and that total maps to an action band:
- Monitor: scores within a range indicating normal variation, continue standard cadence without additional review.
- Intervene: scores indicating moderate deviation, schedule targeted management conversation and request supporting documentation.
- Crisis: scores indicating severe deviation, immediate escalation to senior credit or portfolio leadership with a full review of exposure and options.
Building "what to request" fields
For every indicator scoring 1 or 2, document a specific evidence request rather than a vague follow-up. For DSO drift, request the aged receivables detail by customer. For key-person centralization, request an organizational chart showing decision authority over the past 12 months. For pipeline thinning, request the CRM stage-by-stage conversion history. A documented request field speeds the investigation and creates an audit trail credit committees can rely on later.
Re-score on a fixed cadence, monthly for anything already in the intervene band, quarterly otherwise, and track score trajectory over time rather than a single snapshot. A company holding steady at a score of 20 is a very different case from one that jumped from 8 to 20 in one quarter, even though both land in the same action band.
Signal-to-Action Workflow: Triage, Investigation, and Routing
A threshold breach means nothing until someone owns it and acts inside a defined window. EY's framework ties detection directly to a documented investigation protocol, precisely because unstructured escalation produces both false alarms and missed real ones.
1. Watch tier. Response window: next scheduled review cycle. Action: log the deviation, no outreach required, continue tracking.
2. Warn tier. Response window: within 5 business days. Action: relationship manager or portfolio analyst initiates a check-in call, requests the relevant documentation field tied to the triggered indicator, and logs findings.
3. Alert tier. Response window: within 24 to 48 hours. Action: senior credit officer or portfolio manager is notified directly, a structured management conversation is scheduled immediately, and findings are escalated to committee if the pattern involves two or more domains.
Investigation protocol
Start with the data checklist tied to the specific indicator that triggered. Prepare two or three targeted, specific questions rather than an open-ended "how's business" conversation, since specificity gets faster, more honest answers. If management is unusually slow to produce requested documentation, that delay itself is worth logging as a signal. Escalate when a single indicator crosses into severe territory, when two domains show simultaneous deterioration, or when management's response to a request for information is evasive or incomplete.
Stakeholder routing
Route warn-tier alerts to the assigned relationship manager or portfolio analyst. Route alert-tier signals directly to senior credit leadership and, where the exposure is material, to the credit committee chair. Frame the message around the specific pattern detected and the requested evidence, not a generic risk score.
Pro Tip: Apply a Goldilocks principle to intervention timing. Act too early on a single ambiguous signal and you burn credibility with management teams and your own committee. Wait too long for a full pattern to form and you lose the lead time that made early warnings worth building in the first place. The sweet spot is acting the moment two independent signals corroborate each other.
How AI Changes Early-Warning Detection
Board decks are structurally stale by the time anyone reads them. Diligent's research on portfolio risk signals points out that AI monitoring catches shifts in vendor payment velocity, professional profile activity, and pricing concessions weeks before those same shifts surface in a quarterly board deck, simply because continuous monitoring doesn't wait for a reporting cycle to close.
Certain AI agents are built around that same lead-time advantage. A few capabilities worth understanding:
- Real-time dashboards aggregate behavioral and financial signals continuously, rather than refreshing on a monthly or quarterly cycle.
- Automated alerts route threshold breaches directly to the assigned owner, closing the gap between detection and action that Sopact identifies as the point where most monitoring systems fail.
- Peer benchmarking contextualizes a given signal against comparable institutions and portfolio segments, reducing false positives from company-specific noise.
- Bank-grade security and SOC 2® certification support the audit trail credit committees need when an alert leads to a material credit decision.
None of that replaces sound governance. IBM's OpenPages makes the case plainly: strong model governance, including validation, explainability, and a documented audit trail, is what makes automated detection defensible rather than a black box a regulator distrusts. Every AI-generated alert needs a human-in-the-loop review step before it drives a credit action, and that review needs to be logged with the same rigor as the original signal.
A reasonable pilot design: select three portfolio companies or borrower segments, run continuous AI monitoring in parallel with existing quarterly review for one full quarter, and measure the lead-time delta between when the AI system flagged deterioration and when the same issue would have surfaced in the standard board cycle. That comparison, more than any single feature list, tells you whether the system earns its place in your risk framework. Reviewing AI risk management best practices beforehand helps set realistic validation criteria for that pilot.
How Economic Conditions Reshape Early-Warning Signals
Thresholds calibrated during a stable rate environment will misfire once conditions shift. During a credit tightening cycle, vendor payment stretching becomes far more common across an entire portfolio, not just the weakest names, which means a static threshold set two years earlier will throw far more warn-tier alerts than the same threshold would in a calmer period. That's not a system failure; it's a signal the whole baseline needs recalibrating.
Recession-adjacent periods also change which signals carry the most predictive weight. Pipeline thinning and DSO drift tend to matter more when demand is contracting broadly, while key-person centralization and talent erosion matter more during periods of aggressive labor market competition, when losing a finance lead is harder to backfill quickly. Interest rate moves directly affect covenant headroom calculations, so a company sitting comfortably above covenant in a low-rate environment can slide toward breach purely on refinancing costs, independent of any operational deterioration.
The practical fix is a recalibration cadence tied to macro shifts, not just a fixed annual schedule. When a rate decision, a sector-wide demand shock, or a credit-availability tightening hits, revisit baselines for the affected segments before trusting the next batch of alerts.
Fitting Early Warnings Into Your Broader Risk Framework
An early-warning system that lives outside your existing credit risk framework becomes a second source of truth nobody fully trusts, and that duplication is a common reason pilots stall out. The stronger approach treats early-warning scores as an input to existing risk rating processes, not a parallel scoring system competing with them.
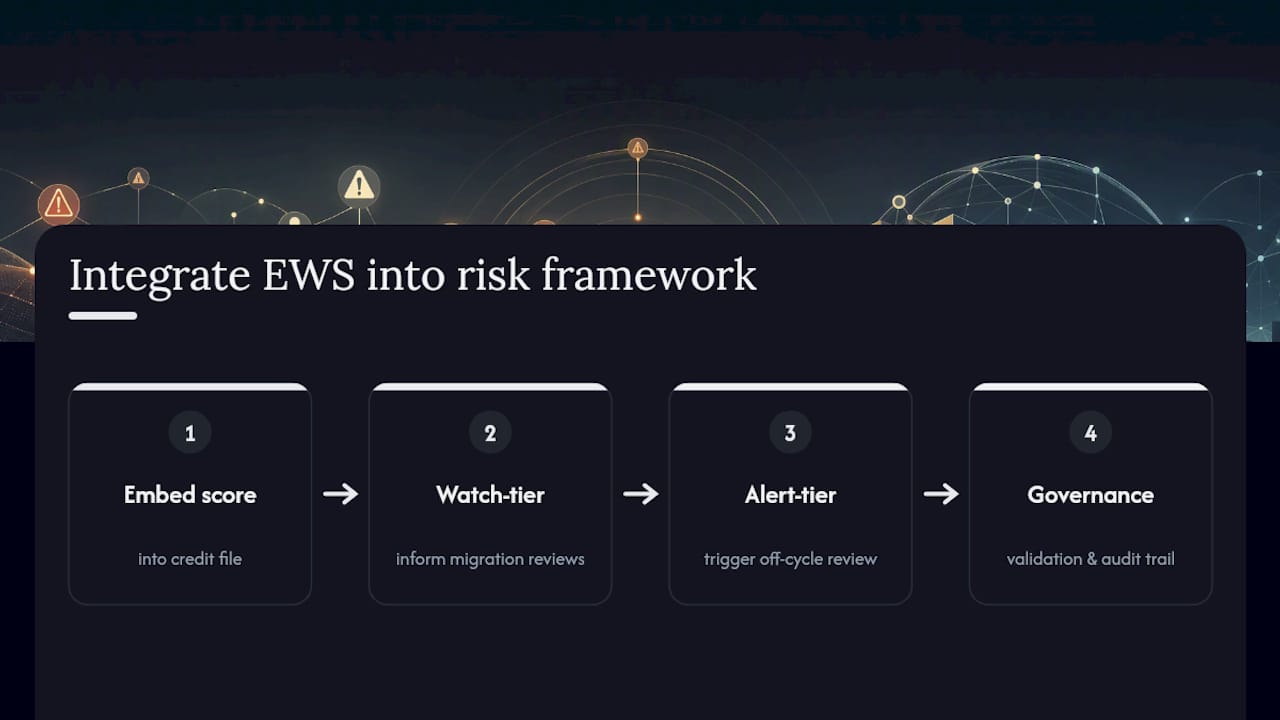
Practically, that means the 25-indicator score and any AI-generated alert history should feed into the same credit file your committee already reviews, alongside covenant compliance, collateral valuation, and traditional financial ratios. Watch and warn-tier signals inform risk rating migration reviews between formal review cycles, rather than waiting for the next scheduled downgrade discussion. Alert-tier signals should trigger an off-cycle risk rating review automatically, with the underlying evidence attached.
Governance also matters here. Model validation teams need visibility into how thresholds are set and recalibrated, and internal audit needs a clear trail showing which alerts were investigated, what was found, and what action followed. IBM's OpenPages frames this as the difference between a monitoring tool and a governed risk management capability, and that distinction is exactly what separates a system regulators trust from one they question.
Prioritizing and Escalating Warnings by Severity
Not every warn-tier alert deserves the same urgency, and treating them identically is how teams burn out on false alarms. Severity should factor in three things together: how many domains are affected, how far the deviation sits from baseline, and how large the exposure is.
A single moderate deviation on a small exposure can sit comfortably in the standard monitor queue. The same deviation on your largest concentration risk exposure deserves an accelerated check-in, even if the score alone wouldn't normally trigger alert tier. Multi-domain patterns, like the burnout cascade or revenue cliff patterns described earlier, should generally escalate faster than a single severe indicator in isolation, since corroboration across independent signals is a stronger predictor than any one metric spiking alone.
Build an escalation matrix that weights exposure size as a multiplier on the base severity score, not a separate consideration reviewed after the fact. A $50,000 exposure and a $5 million exposure showing identical warning patterns should not follow the same response timeline. Document the weighting logic so it's consistent across the portfolio and defensible to a regulator or auditor asking why one alert moved faster than another.
Where Early-Warning Systems Go Wrong
Three failure patterns show up repeatedly once teams start building these systems. Over-alerting tops the list: thresholds set too tight generate so much noise that analysts start ignoring alerts entirely, which defeats the purpose. Widen the threshold or require corroboration from a second signal before escalating. Weak baselines come next: teams that skip the initial measurement period and borrow generic industry thresholds end up flagging perfectly normal borrower behavior as distress. Take the time to build a real trailing baseline before trusting any threshold.
Slow routing is the third, and often the most damaging: a well-designed alert that sits in an inbox for two weeks before anyone acts has lost most of its value. Fix it by assigning a named owner and a response window to every tier, not just the alert tier.
A useful next step: pilot the system on three companies for one quarter and measure the lead-time delta against your existing review process. Document every threshold decision and every recalibration in a living playbook, since that documentation is what keeps management teams and committees trusting the system when it flags something they'd rather not hear.
— Raj
How RiskInMind Supports Early-Warning Monitoring
Some platforms provide portfolio managers with continuous, AI-driven monitoring that flags behavioral and financial deviations the moment they cross a threshold, rather than waiting for quarterly review cycles.
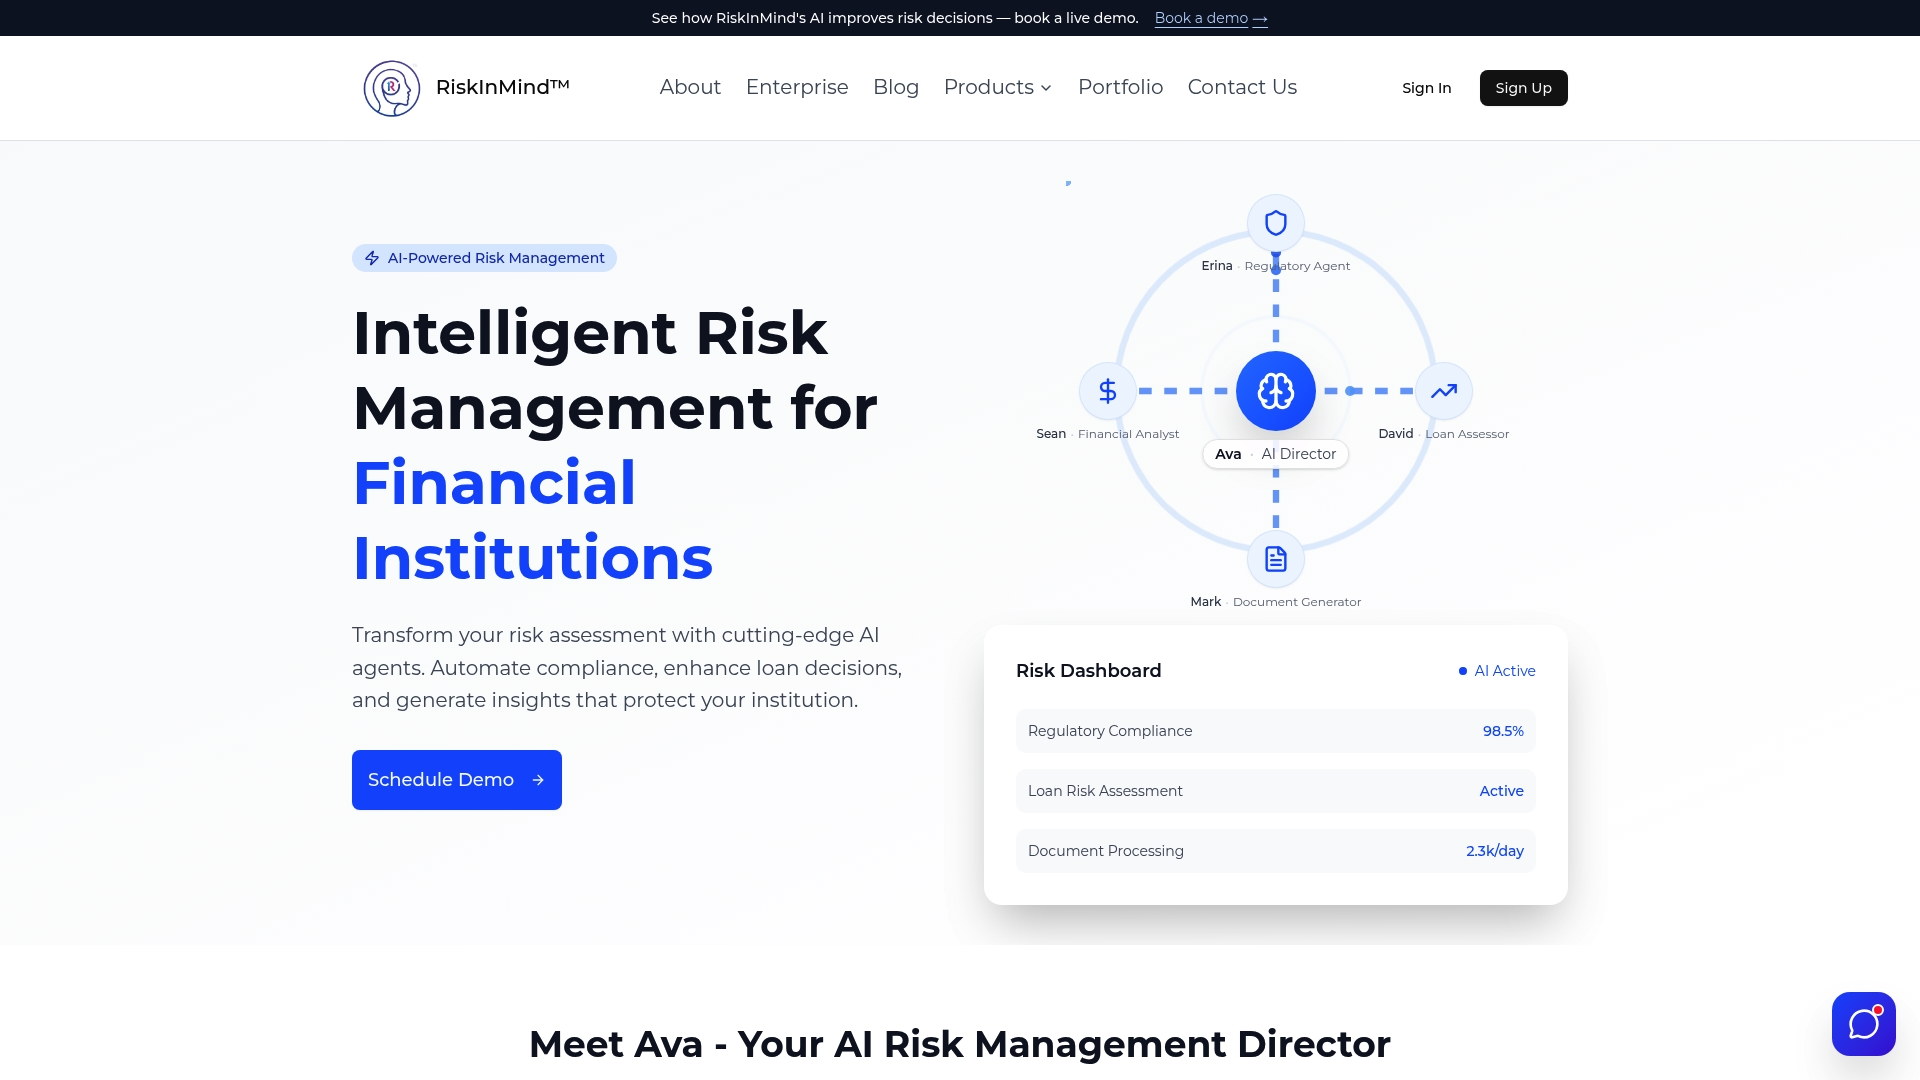
Certain platforms use specialized AI agents coordinated by a central director, applying watch, warn, alert logic with real-time dashboards and automated routing so signals reach the right owner without manual triage. Peer benchmarking contextualizes each alert against comparable institutions, which helps separate genuine deterioration from sector-wide noise. If you're evaluating a pilot, a practical scope looks like three portfolio segments, your existing data connectors, and a lead-time comparison against your current review cadence. Explore RiskInMind's solutions for portfolio managers and request a demo to see how the diagnostic and workflow map onto your own loan book.
Sources
- AI-enabled early warnings signals framework
- The 6 Early Warning Signals That Predict Portfolio Company Distress | Zoe Diagnostics
- Early Warning Signs Diagnostic: 25-indicator portfolio company health diagnostic | A Faster Exit
- How Do You Monitor Portfolio Risk in Real Time? — Sopact
- OpenPages — IBM
FAQ
Is Early Warning a Legit Approach for Portfolio Risk?
Yes. Early-warning monitoring is a well-established credit risk discipline, and frameworks like EY's AI-enabled model confirm it reduces the lag between deterioration and detection when built with documented thresholds and investigation protocols.
How Long Do Early-Warning Flags Stay on a Borrower's Record?
There's no universal retention rule; it depends on your institution's credit file retention policy and regulatory requirements. Most institutions keep the full alert history, including resolved watch and warn-tier flags, attached to the credit file for the life of the relationship.
What Are the Core Pillars of an Early-Warning System?
A working system rests on defined signal categories (behavioral and financial), baselines with calibrated thresholds, a scoring or diagnostic framework that maps to action, and a routing protocol that gets alerts to a named owner within a set response window.
What Does an Early-Warning Alert Actually Mean for a Portfolio Manager?
It means a specific indicator or pattern has crossed a defined threshold and needs a proportionate response, ranging from continued monitoring at the watch tier to an immediate management conversation at the alert tier, not an automatic default or downgrade.
How Do AI Agents Improve on Traditional Quarterly Monitoring?
AI agents like those in RiskInMind's platform monitor signals continuously rather than on a fixed cycle, which can surface deterioration weeks before it would appear in a quarterly board deck, according to research on AI-detected portfolio risk signals.