
Operational risk indicators are measurable metrics that monitor risk exposure across key operational domains, providing early warnings before losses occur. The types of operational risk indicators recognized by the Basel Committee span six core categories, covering people, processes, systems, external events, financial reporting, and compliance. Industry-standard programs track 15–25 active indicators per business unit and recommend that at least 45% of those indicators be leading metrics. That ratio matters because leading indicators give risk managers time to intervene, while lagging indicators only confirm what already went wrong. Calibrated thresholds tied to your institution's risk appetite turn raw data into escalation triggers that drive governance action.
1. Types of operational risk indicators: the six core categories
The six Basel-aligned categories form the standard framework for operational risk indicator programs at financial institutions. Each category targets a distinct domain where operational failures originate, and coverage across all six is what separates a comprehensive program from a fragmented one.
Maintain 100% NCUA & OCC Audit Readiness
Monitor regulatory updates 24/7, check internal credit policies, and generate compliance trails with Erina (AI Regulatory Agent).
- People and HR: Employee turnover rates, conduct incidents, training completion rates, and error rates per staff member. High turnover in compliance roles is a leading indicator of control degradation.
- Processes and internal controls: Control failure rates, overdue control testing, exception volumes, and audit findings. These metrics reveal where your governance framework is weakest.
- Systems and technology: System uptime, mean time to recover (MTTR), unplanned outages, and patch cycle compliance. A risk technology integration checklist helps institutions map these metrics to specific system dependencies.
- External events and third parties: Vendor SLA breach rates, vendor concentration ratios, and third-party incident response times. Outsourcing risk is one of the fastest-growing operational exposure areas.
- Financial reporting and accounting: Reconciliation break age, material weakness counts, and late close rates. These metrics sit at the intersection of operational and financial risk.
- Compliance and regulatory: Open regulatory findings, overdue audit issues, and the number of matters requiring attention (MRAs) from examiners. Real-time compliance monitoring converts these counts into live dashboard signals.
Pro Tip: Do not treat these six categories as silos. A technology outage (systems category) can trigger reconciliation breaks (financial reporting category) and generate regulatory findings (compliance category) within the same incident cycle.
2. Leading vs. lagging indicators: knowing which metric does what

Leading and lagging indicators serve fundamentally different purposes, and confusing them produces a monitoring program that reacts instead of prevents. Leading KRIs give advance warning before a risk event occurs. Lagging KRIs record what happened after the fact.
| Indicator type | Definition | Example in financial institutions | Primary use |
|---|---|---|---|
| Leading | Predicts a future risk event | Staff turnover in compliance roles | Early intervention before control failure |
| Lagging | Measures a past loss or event | Operational loss amounts, MRA count | Historical analysis, capital calculation |
| Mixed | Can function as either depending on context | Unplanned system downtime | Productivity measure or risk tolerance signal |
The distinction between leading and lagging is not always fixed. Unplanned downtime, for instance, measures productivity loss when tracked against output targets, but functions as a risk tolerance signal when measured against a defined uptime threshold. Context determines the category.
Leading indicators must make up at least 45% of your indicator portfolio to enable proactive risk management. Institutions that rely predominantly on lagging metrics are, in effect, documenting losses rather than preventing them. That distinction has direct capital implications under Basel III.
Pro Tip: When building your indicator library, tag each metric as leading, lagging, or mixed at the point of design. Revisit those tags annually. Operational environments change, and a metric that once predicted risk may now only confirm it.
3. How to calibrate thresholds and escalation protocols
Calibration is where most operational risk indicator programs fail. A metric without a threshold is just a number. A threshold without an escalation path is just a color on a dashboard.
The standard approach uses a three-tier RAG (Red, Amber, Green) framework. RAG thresholds align the Red level with the institution's formal risk appetite boundary. The Amber level sits at 60–80% of the Red threshold, functioning as an early management warning that triggers intervention before a limit breach.
Setting thresholds requires numeric or percentage triggers defined per KRI, not general descriptions. For example:
- System uptime KRI: Green above 99.5%, Amber at 98.0–99.4%, Red below 98.0%.
- Reconciliation break age: Green if all breaks resolved within 3 days, Amber if any break exceeds 5 days, Red if any break exceeds 10 days.
- Open MRA count: Green at zero, Amber at 1–2 open items, Red at 3 or more.
- Staff turnover in compliance roles: Green below 10% annually, Amber at 10–15%, Red above 15%.
- Vendor SLA breach rate: Green below 2%, Amber at 2–5%, Red above 5%.
Effective KRIs require clear escalation paths with specified owners and triggers. Without named owners, a Red signal produces a report that no one acts on. Assign each KRI an escalation owner, whether the COO, the Chief Risk Officer, or the board risk committee, and define the response timeline at each threshold level. Reviewing your risk reporting frequency practices is a practical starting point for aligning escalation cadence with governance cycles.
4. Practical examples of key risk indicators by category
Concrete examples make the difference between a theoretical framework and a working program. The following KRIs represent the most operationally significant metrics across each of the six categories.
People and HR indicators:
- Employee error rate per 1,000 transactions (leading): rising rates predict process control failures before losses occur.
- Compliance role turnover rate (leading): staff turnover in compliance functions predicts control failures, making it one of the highest-value leading metrics available.
- Training completion rate for mandatory programs (leading): completion below threshold signals regulatory exposure.
Process and internal control indicators:
- Overdue control testing rate (leading): the percentage of scheduled control tests not completed on time.
- Exception volume per process (mixed): rising exception counts signal process deterioration before formal audit findings emerge.
- Audit findings open beyond 90 days (lagging): a direct measure of remediation effectiveness.
Systems and technology indicators:
- Seven key operational KRIs include system uptime and MTTR as two of the most universally tracked metrics. Critical system uptime below threshold is a leading signal of potential outage-driven losses.
- Mean time to recover (MTTR) from incidents (lagging): measures resilience after a failure occurs.
- Patch cycle compliance rate (leading): unpatched systems are a leading indicator of cybersecurity and operational exposure.
External and third-party indicators:
- Vendor SLA breach rate (lagging): the percentage of contracted service levels missed by third-party providers.
- Vendor concentration ratio (leading): the share of critical processes dependent on a single vendor, a forward-looking exposure measure.
Financial reporting indicators:
- Reconciliation break age (mixed): breaks aged beyond defined thresholds signal both process failure and potential financial misstatement.
- Material weakness count (lagging): a direct output of internal control failures with regulatory reporting consequences.
Compliance and regulatory indicators:
- Open MRA count (lagging): the number of matters requiring attention from regulators, each representing a documented control gap.
- Overdue audit issue rate (lagging): the percentage of audit findings not remediated within agreed timelines.
A risk dashboard features checklist helps institutions confirm that each of these metrics is visible, threshold-coded, and assigned to an owner before the program goes live.
Key takeaways
Operational risk indicator programs succeed when they combine Basel-aligned category coverage, a leading indicator majority, numeric RAG thresholds, and named escalation owners for every metric.
| Point | Details |
|---|---|
| Six Basel-aligned categories | Cover people, processes, systems, external events, financial reporting, and compliance for complete risk oversight. |
| 45% leading indicator minimum | Maintain at least 45% leading metrics to enable intervention before losses occur, not after. |
| Numeric RAG thresholds required | Define exact percentage or count triggers per KRI; general descriptions do not produce governance action. |
| Named escalation owners | Assign a specific owner (COO, CRO, board) to each KRI threshold breach to convert data into decisions. |
| KRI-to-causation mapping | Every indicator must map to a documented risk event pathway, otherwise it generates data noise, not governance value. |
Why most KRI programs underdeliver, and what actually fixes them
The failure mode I see most often is not a shortage of data. It is an excess of metrics that no one has mapped to a causal risk pathway. A KRI must map to a documented causal risk event pathway to be meaningful. Without that mapping, you are measuring activity, not exposure.
The second failure mode is the KRI-KPI confusion. KRIs measure proximity to a risk event. KPIs measure performance against a target. Confusing them means you end up monitoring whether your operations team is hitting productivity goals rather than whether your control environment is deteriorating. Those are different questions with different governance implications.
The governance gap is real and well-documented. 82% of organizations use KRIs to track emerging threats, but only 14% successfully integrate KRIs with KPIs for executive decision-making. That 68-point gap represents institutions where risk data exists but does not reach the people who can act on it.
Basel III SMA changes make KRI data accuracy critical because operational losses feed directly into capital calculations. Misclassifying a loss event is not just a data quality problem. It is a capital adequacy problem. That regulatory reality should be the argument that gets your KRI program the budget and executive attention it deserves.
My practical recommendation: start with fewer indicators, map each one to a specific risk scenario, assign a named owner, and define numeric thresholds before you go live. A program with 12 well-calibrated KRIs outperforms one with 50 metrics that no one escalates.
— Raj
Riskinmind's operational risk tools for financial institutions
Financial institutions that need to move from spreadsheet-based KRI tracking to a governed, real-time monitoring environment have a direct path forward with Riskinmind.
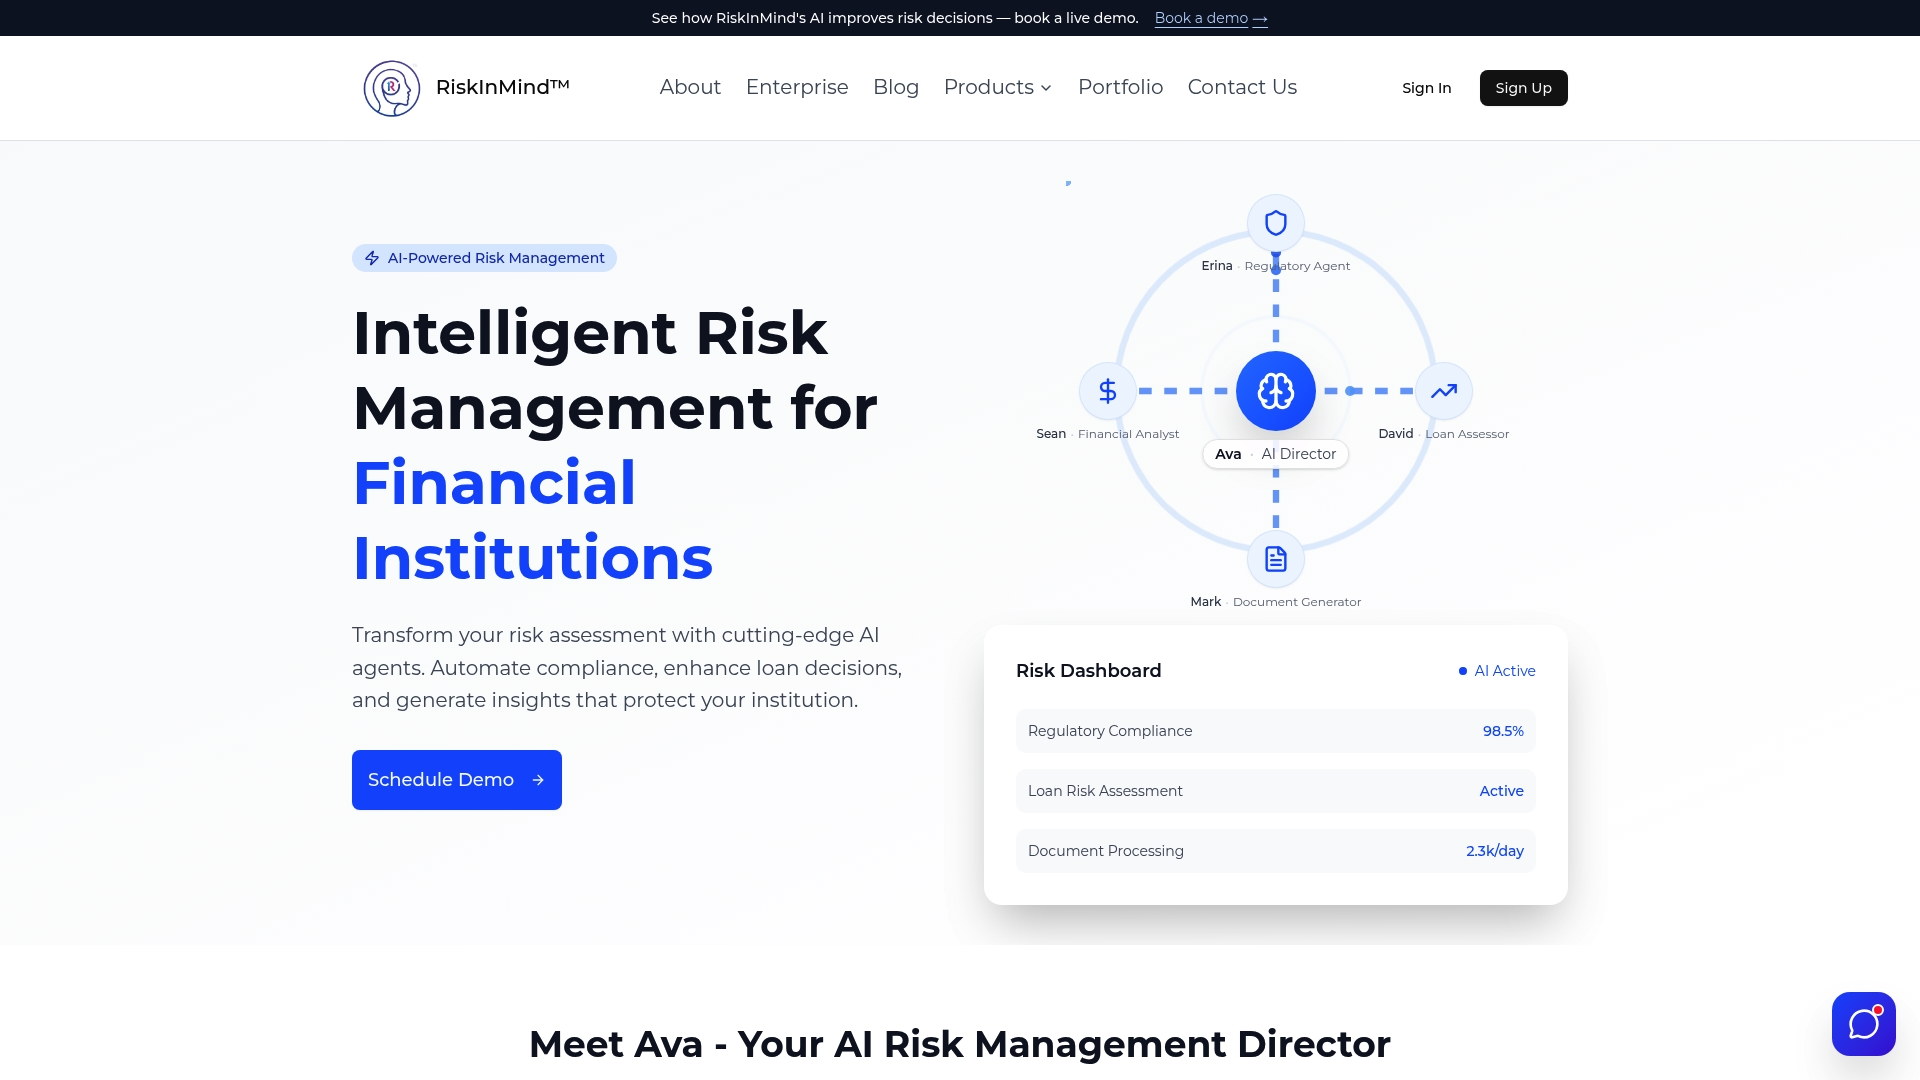
Riskinmind's AI-powered platform supports operational risk assessment across credit and loan workflows, with purpose-built tools for community banks, credit unions, and lenders. The loan application risk assessment tool integrates operational risk metrics directly into underwriting workflows, while the peer benchmarking module lets your institution compare KRI performance against industry peers. Both tools operate under SOC 2® certification with response times under half a second, meeting the data accuracy standards that Basel III SMA compliance demands.
FAQ
What are the main types of operational risk indicators?
The main types of operational risk indicators span six Basel-aligned categories: people and HR, processes and internal controls, systems and technology, external events and third parties, financial reporting, and compliance and regulatory metrics. Each category targets a distinct domain where operational failures originate.
What is the difference between leading and lagging KRIs?
Leading KRIs predict a future risk event, such as rising staff turnover in compliance roles signaling an impending control failure. Lagging KRIs measure past losses or events, such as operational loss amounts or open MRA counts from regulators.
How many KRIs should a financial institution track?
Industry-standard programs track 15–25 active indicators per business unit, with at least 45% classified as leading indicators. Tracking fewer, well-calibrated metrics consistently outperforms maintaining a large library of poorly governed ones.
What is a RAG threshold in operational risk management?
A RAG threshold is a three-tier Red, Amber, Green framework that assigns numeric triggers to each KRI. Red aligns with the institution's formal risk appetite boundary, while Amber sits at 60–80% of the Red level and triggers early management intervention.
Why do KRI programs fail to drive governance action?
Setting escalation procedures is the most critical step in KRI implementation. Programs fail when metrics lack named owners, numeric thresholds, or defined response timelines, producing data that never translates into a governance decision.