
Risk data quality is the measure of whether your data is accurate, complete, timely, and consistent enough to support real risk decisions and regulatory reporting. The single highest-leverage move you can make right now is scoping your critical data elements and assigning named data owners and stewards to them. Regulators expect this discipline to show up in your reporting timelines, not just your policy documents.
TL;DR:
- Prioritizing and automating reconciliation for the top five critical data elements can lead to measurable improvements within 90 days.
- Defining clear acceptance tolerances and root causes for data issues helps focus remediation efforts on systemic problems rather than one-off fixes.
- Continuous monitoring tools like lineage maps and anomaly detection are essential to prevent data quality degradation over time.
- A small set of key metrics, such as error rate trends and reconciliation pass rates, should be tracked regularly and linked to operational outcomes.
- Using automation platforms with real-time validation and governance features accelerates compliance and reduces risks associated with poor data quality.
Automate Regulatory Model Risk Governance
Examine models against 32 qualitative criteria and resolve risk Tiers with pre-deployment checklists per OCC 2011-12 guidelines.
Table of Contents
- What Risk Data Quality Means for Risk Reporting
- How Poor Data Quality Increases Operational and Business Risk
- How to Assess Risk Data Quality: Method and Metrics
- Best Practices to Improve Risk Data Quality
- Continuous Monitoring and Risk-Adaptive Governance
- Measuring Success and Reporting to Leadership
- How Riskinmind's Approach Maps to These Recommendations
- Practical Pitfalls and Quick Wins
- Where Riskinmind Fits Into Your Remediation Plan
- Sources
- FAQ
What Risk Data Quality Means for Risk Reporting
Risk data quality is not an abstract IT metric. It is a fitness test: does this specific data element support the specific risk decision or regulatory report it feeds? A loan-loss reserve calculation and a board liquidity dashboard have different tolerance for lag, different sensitivity to rounding, and different consequences when they're wrong.
Five dimensions define whether data clears that bar:
- Accuracy: the value matches reality, or a defensible reference point when no perfect source exists
- Completeness: no missing fields in fields that drive exposure calculations
- Timeliness: data reflects conditions current enough for the decision at hand, not last quarter's snapshot
- Consistency: the same customer or exposure reads identically across systems
- Validity: values conform to defined formats, ranges, and business rules
A useful way to structure assessment is the five-facet model: data, source, system, task, and human factors each contribute differently to whether a number is trustworthy. A perfectly accurate figure pulled at the wrong time, for the wrong task, still fails the test.
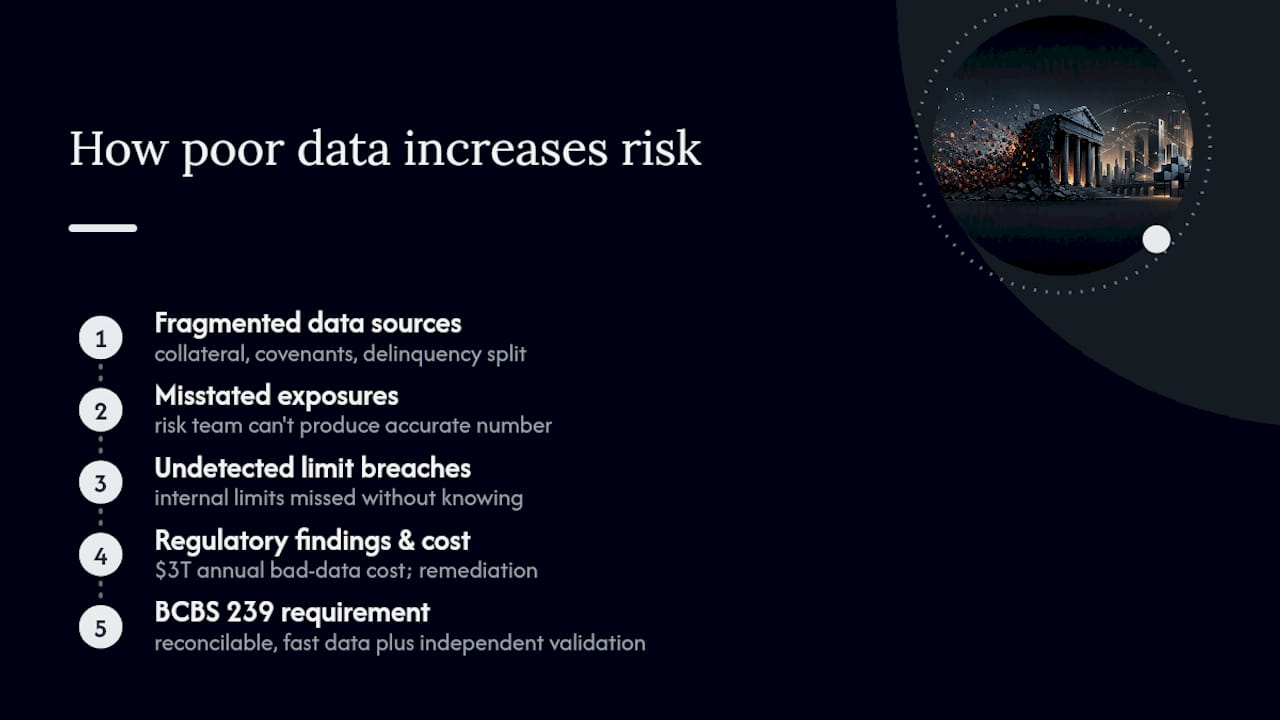
How Poor Data Quality Increases Operational and Business Risk
Bad risk data doesn't just create inconvenience. It misstates exposures, causes institutions to miss internal limits without knowing it, and triggers regulatory findings that are expensive to remediate under supervisory deadlines. Industry research pegs the annual cost of bad data at $3 trillion in the United States alone, a figure that captures everything from failed transactions to mispriced risk.
Consider a stress scenario: a regional lender's commercial real estate book deteriorates fast during a rate shock. If collateral values, covenant flags, and delinquency status live in three systems that don't reconcile, the risk team can't produce an accurate exposure number for the board in the timeframe leadership needs it. That delay itself becomes the risk event. BCBS 239 exists precisely because of failures like this, requiring that risk data be reconcilable and available fast enough to support action, especially under stress, with independent validation expected as a check against exactly this kind of blind spot.
How to Assess Risk Data Quality: Method and Metrics
A credible data quality assessment (DQA) follows a repeatable sequence rather than an ad hoc scramble every time an examiner asks a question.
- Scope your critical data elements (CDEs) tied to specific risk reports, not every field in every system
- Profile and sample the data to surface missing values, outliers, and format violations
- Define acceptance tolerances for each CDE, since perfect accuracy is rarely measurable without a clean reference source
- Classify root causes (source system defect, manual entry error, stale feed, mapping mismatch) so remediation targets the actual problem
IBM's framework for data quality assessment describes this profiling and root-cause classification as the backbone of any serious remediation plan, and it maps cleanly onto risk reporting cycles.
A composite quality score matters more than any single metric. Track error rate, completeness ratio, freshness against your reporting deadline, and reconciliation pass rate together, then weight them by the CDE's impact on capital or credit decisions rather than treating every field equally.
Independent validation closes the loop. Documented reconciliation between source and reported figures, reviewed by someone outside the team that produced the number, is what turns a data quality claim into something an auditor or examiner will accept. Supervisory guidance on risk data aggregation treats this independence as a baseline expectation, not a nice-to-have for institutions with mature programs.
Best Practices to Improve Risk Data Quality
Fixing risk data quality works best as a prioritized sequence, not a simultaneous assault on every dataset you own.
- Map every CDE to the specific report or regulatory return it feeds, then set a tolerance level for each one
- Assign a named data owner and steward per domain, with service-level agreements for correction turnaround
- Maintain a live issue register that tracks severity, root cause, and remediation deadline for every open defect
- Fix problems at the source system rather than patching them downstream in a spreadsheet
- Enforce business rules and validation logic at the point of entry, and automate exception handling so violations get flagged instead of silently passed through
- Build metadata, lineage, and a data catalog so any number can be traced back to its origin and reproduced during an audit
- Put independent validation and periodic audits on a fixed calendar, with results reported to the risk committee, not just IT
Pro Tip: Start your issue register with the five CDEs that feed your largest capital or credit-loss calculations. Fixing those first produces a measurable score improvement fast enough to keep sponsors engaged, instead of disappearing into a multi-year cleanup with no visible wins.
Supervisory guidance from the ECB specifically calls out detailed quality requirements, KPIs, and an issue register with documented remediation deadlines as core governance components. Institutions that skip the register tend to fix the same defect repeatedly because nobody tracked why it recurred.
Continuous Monitoring and Risk-Adaptive Governance
A one-time cleanup degrades within a quarter if nothing watches the pipeline afterward. Data observability closes that gap: lineage maps show where a number came from, freshness alerts catch a feed that stopped updating, and dependency maps show which downstream reports break when an upstream source changes.

Static governance, where every dataset gets the same fixed rule regardless of context, is increasingly outmatched by volatile risk environments. A risk-adaptive governance model applies contextual thresholds instead. A concentration metric during a stable quarter tolerates more latency than the same metric during a liquidity event, and the governance controls should tighten automatically when conditions change.
On the technology side, this usually means a profiling engine running continuously, an orchestration layer such as Airflow or dbt managing pipeline dependencies, and anomaly detection tuned to flag deviations that matter for risk exposure rather than every statistical blip. Static rules, checked quarterly, cannot keep pace with that kind of shift.
Measuring Success and Reporting to Leadership
Leadership needs a small set of numbers tracked consistently, not a dashboard with forty tiles.
- Aggregated data quality score, trending over time rather than a single snapshot
- Error rate trend by CDE, showing whether remediation is actually reducing defects
- Mean time to remediate an identified issue, from detection to close
- Reconciliation pass rate across source and reported figures
Report operational-level detail to data owners weekly, summarized trends to the risk committee monthly, and material issues or regulatory exposure to the board on whatever cadence your examiners expect, typically quarterly at minimum. Tie each metric to a business outcome your leadership already cares about: hours saved on manual reconciliation, exposure figures that stopped requiring restatement, or a finding that closed before it became a regulatory citation.
How Riskinmind's Approach Maps to These Recommendations
Riskinmind's platform is built around the same discipline this article describes: automated profiling, real-time risk dashboards, and remediation workflows that route exceptions to the right owner instead of a shared inbox. The platform carries SOC 2® certification and bank-grade security, signals that matter when examiners ask how you protect the data feeding your risk reports. A demo or pilot is the fastest way to see how automated validation fits your existing reporting cycle.
Practical Pitfalls and Quick Wins
Most risk data quality programs stall for the same reasons: teams try to scope every dataset instead of the handful that actually drive capital decisions, metadata gets treated as documentation busywork instead of the thing that makes reconciliation possible, and one-off manual fixes get logged as "resolved" when the root cause never got addressed.
Start smaller than feels comfortable. Prioritize your top five CDEs, automate reconciliation for the report with the highest regulatory visibility, and open an issue register before you fix a single defect. Get a senior sponsor before you start, and put a board update on the calendar within 90 days. The deadline encourages prioritization more effectively than many internal policy documents.
— Raj
Where Riskinmind Fits Into Your Remediation Plan
Building the profiling scripts, lineage maps, and exception workflows described above from scratch takes most risk teams months, often longer than the regulatory timeline allows. Certain platforms utilize AI agents to run credit risk assessment, compliance monitoring, and portfolio analysis under a central coordinating system, enabling profiling and reconciliation tasks to run continuously rather than during infrequent cleanup cycles.
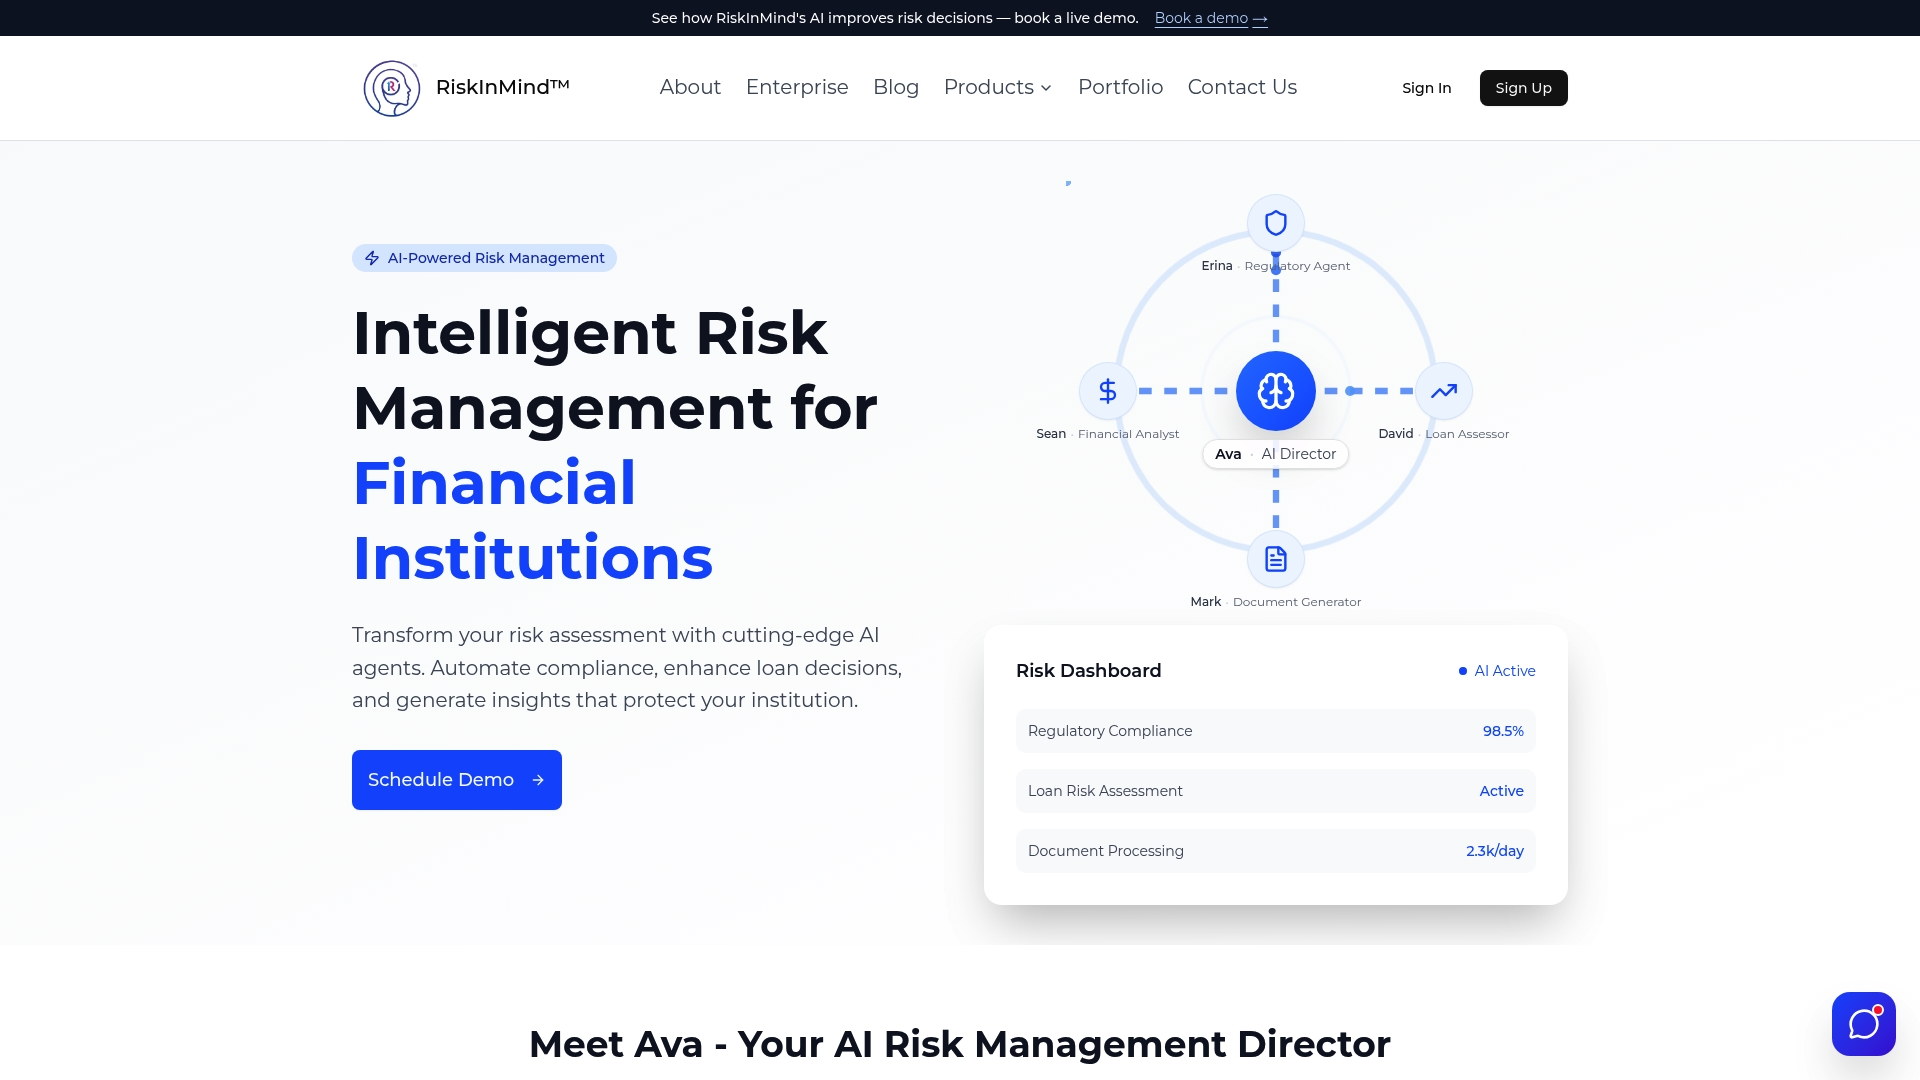
For institutions building out exposure reporting and CDE mapping, the loan application platform automates underwriting data capture at the point of entry, which is where most defects originate in the first place. Portfolio and lending teams comparing their data quality metrics against similar institutions can use peer benchmarking to see whether their error rates and completeness ratios are in line with comparable lenders. If your next board update needs a credible data quality story, a demo is the fastest way to find out what a pilot would surface in your own portfolio.
Sources
For primary-source grounding beyond this article, review the BCBS 239 principles, the ECB's supervisory guide on risk data aggregation, the ISO/IEC 25024 data quality measurement standard, and the five-facet data quality assessment framework referenced throughout this guide.
- Guide on effective risk data aggregation and risk reporting
- What Is a Data Quality Assessment? | IBM
- DRADG: A Dynamic Risk-Adaptive Data Governance Framework for Modern Digital Ecosystems
FAQ
What are the five core elements of data quality?
The five core dimensions are accuracy, completeness, timeliness, consistency, and validity, each mapped to whether the data supports the specific risk decision or report it feeds.
What are recognized data quality standards?
ISO/IEC 25024 provides a framework for quantitatively measuring data quality characteristics, while BCBS 239 sets supervisory expectations for accuracy, completeness, and timeliness specifically in risk data aggregation and reporting.
What types of risk does poor data quality create?
Poor data quality contributes to credit, market, liquidity, operational, compliance, reputational, and model risk, since misstated or incomplete data can distort exposure calculations across any of these categories.
What are key risk indicators for data quality?
Common indicators include the error rate by critical data element, completeness ratio, reconciliation pass rate, and mean time to remediate a flagged issue, tracked together as a composite data quality score.
Does Riskinmind help with risk data quality specifically?
Riskinmind's AI agents run continuous profiling, compliance monitoring, and portfolio analysis coordinated through Ava, which supports the kind of ongoing validation and remediation workflow this article recommends over periodic manual reviews.