
Risk management professionals at financial institutions face a persistent and costly problem: the reports they produce are not delivering the strategic value leadership needs. A striking 41% of top management at large financial institutions are dissatisfied with their firm's risk reporting effectiveness. Understanding how to optimize risk reporting means moving beyond compliance checkboxes and toward reports that actually inform decisions, surface emerging threats early, and satisfy increasingly demanding regulatory standards. This article breaks down the prerequisites, execution steps, common failure points, and success metrics for transforming your institution's risk reporting function.
Table of Contents
- Key Takeaways
- How to optimize risk reporting: prerequisites and foundations
- A step-by-step guide to enhancing risk reporting processes
- Common pitfalls when improving risk reporting
- Measuring whether your optimizations are actually working
- My perspective on risk reporting as a strategic asset
- Take your risk reporting further with Riskinmind
- FAQ
Maintain 100% NCUA & OCC Audit Readiness
Monitor regulatory updates 24/7, check internal credit policies, and generate compliance trails with Erina (AI Regulatory Agent).
Key Takeaways
| Point | Details |
|---|---|
| Start with foundations | Define clear reporting objectives, governance roles, and data collection standards before redesigning any report. |
| Quantify risks financially | Replace heatmaps with Monte Carlo simulations and dollar-denominated loss estimates to give boards decision-ready data. |
| Tailor reports by audience | Executives need concise, two-page summaries of top risks; operational teams need detailed, action-oriented breakdowns. |
| Automate for real-time visibility | AI-driven dashboards replace static PDFs and support proactive decision-making with continuous monitoring. |
| Close the feedback loop | Reports that visibly influence decisions motivate staff to report accurately, including near-miss incidents. |
How to optimize risk reporting: prerequisites and foundations
Before you redesign a single report template, you need to audit what you are working with. Improving risk reporting without first clarifying objectives is like recalibrating instruments without knowing what you are measuring.
Start by aligning your reporting objectives with institutional strategy. A credit union managing mortgage concentration risk has different reporting priorities than a community bank with a high volume of commercial and industrial loans. Your reports must speak directly to the risks that matter most to your institution's specific portfolio and risk appetite.
Data collection is the second pillar. Most institutions undercount their actual risk exposure because near misses go unreported due to fear of blame. A formal near-miss reporting protocol, with anonymous submission options and clear acknowledgment procedures, captures the leading indicators that lagging metrics miss entirely.
Pro Tip: Before rolling out any new reporting framework, map every existing data source to a risk category and identify gaps. This single exercise typically reveals three to five blind spots in your current risk coverage.
Governance structure matters too. Assign explicit ownership for each risk category, including a named individual accountable for data accuracy and report sign-off. Without role clarity, report quality degrades over time and accountability dissolves.
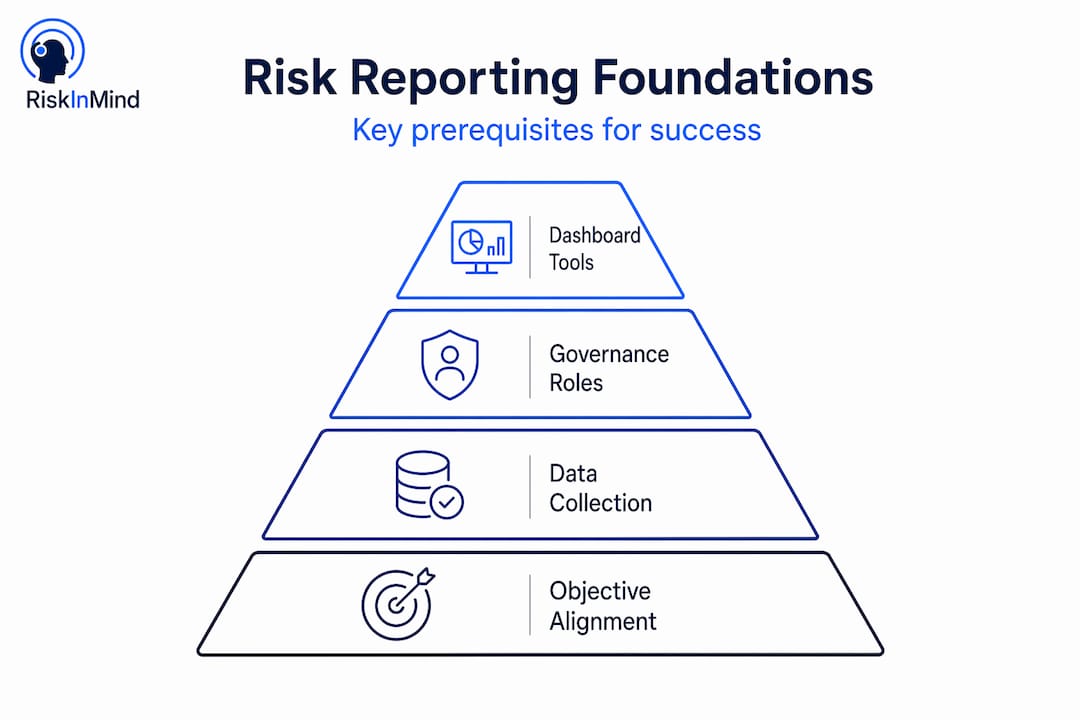
On the technology side, a well-configured risk dashboard checklist helps institutions move away from static spreadsheets toward live monitoring environments. Finally, confirm your regulatory obligations. The FCA's enhanced SMCR rules, for instance, require initial incident reports within 24 hours of threshold determination and final reports within 30 working days post-resolution. Building those timelines into your reporting calendar is non-negotiable.
A step-by-step guide to enhancing risk reporting processes
With the foundations in place, you can move to execution. The following sequence reflects how institutions that successfully upgrade their reporting processes actually do it, not just how frameworks say it should work in theory.
-
Establish both vertical and horizontal communication channels. Vertical channels carry risk information up to the board and down to operational teams. Horizontal channels connect risk functions across business lines, preventing the siloed reporting that obscures institution-wide exposure. Both are required for genuine risk visibility.
-
Incorporate near-miss data into standard reports. Near-miss incidents are early warning signals, and they are far more common than actual loss events. Incorporating near-miss trends alongside incident data gives your board a forward-looking view rather than a backward-looking summary of damage already done.
-
Transition from qualitative heatmaps to financial quantification. Traditional red-amber-green heatmaps are subjective and unreliable for fiduciary decisions. Financial quantification translates risks into decision-ready terms. For example, a 15% probability of a loss between $8M and $45M produces an expected annual loss figure of $4.2M, a number your CFO and board members can act on. Monte Carlo simulations using calibrated frequency and severity estimates make this possible even for risks that lack extensive historical data.
-
Write reports your executives will actually read. Research confirms that executive leadership prefers concise reports under two pages, focused on top risks, trends, and explicit decision points. Every sentence that does not serve a decision or highlight a trend is a sentence that dilutes the report's impact. Cut it.
-
Deploy automated real-time dashboards. The shift from static PDFs to AI-driven dashboards is not just a convenience upgrade. Real-time monitoring changes how quickly your institution can respond to emerging credit risk, liquidity stress, or operational disruptions. It transforms reporting from a periodic artifact into a continuous management tool.
-
Build iteration and feedback loops into the process. After each reporting cycle, gather structured input from report consumers, including board members, department heads, and front-line risk staff. What questions did the report fail to answer? What data would have changed a decision? Use those answers to sharpen the next cycle.
Pro Tip: When presenting quantified risk scenarios to the board, lead with the expected annual loss figure, then offer the range. Decision-makers anchor on a single number. Give them the right one first.
| Approach | Qualitative heatmap | Financial quantification |
|---|---|---|
| Output format | Color-coded risk matrix | Dollar-denominated loss estimates |
| Decision utility | Low, subjective rankings | High, directly comparable to capital |
| Data requirements | Minimal | Expert-calibrated frequency and severity inputs |
| Board relevance | Limited | High, supports fiduciary responsibility |
| Regulatory alignment | Acceptable baseline | Preferred for advanced risk governance |
Common pitfalls when improving risk reporting
Even well-resourced institutions run into predictable obstacles when they attempt to upgrade their reporting processes. Knowing where others have stalled saves significant time and credibility.

The most pervasive problem is organizational siloing. Credit risk, operational risk, and market risk functions often maintain separate data repositories and separate reporting rhythms. When those streams never merge, senior leadership sees a fragmented picture that misrepresents actual institutional exposure. Breaking silos requires governance-level commitment, not just a technology integration project.
A closely related issue is the reporting culture itself. Trust is foundational to open risk reporting. When employees believe that surfacing a problem will result in blame rather than resolution, they stop surfacing problems. Institutions that solve this invest in dedicated reporting contacts, clear acknowledgment protocols, and visible examples of management acting constructively on reported concerns.
"Without clear feedback loops linking reports to decisions, operational staff lose motivation to report accurate data." — ISB Finance Study
Information overload is another common failure. When reports grow to cover every conceivable risk in exhaustive detail, the genuinely critical signals get buried. Tailoring report content by audience is not optional. Executives need strategic synthesis, while operational teams need granular, action-oriented detail. Sending the same report to both audiences serves neither.
The box-ticking mentality deserves specific attention. Institutions that treat risk reporting as a regulatory obligation rather than a management tool produce reports that satisfy examiners but do not actually change decisions. The antidote is deliberate: every risk report should contain at least one explicit decision point or action item linked to a named owner and a deadline. Reports that drive no action are not risk management. They are documentation theater.
Data quality problems tend to surface during financial quantification projects. Calibrating Monte Carlo models requires reliable frequency and severity estimates, which demand clean, consistently categorized historical incident data. Many institutions discover their incident logs are incomplete or inconsistently labeled only when they attempt to build quantification models for the first time. Address data governance before attempting quantification.
Measuring whether your optimizations are actually working
Optimizing risk reporting is not a one-time project. You need metrics that tell you whether the changes are delivering results, and those metrics need to be reviewed regularly.
| Metric | What it measures | Target benchmark |
|---|---|---|
| Report timeliness | Percentage of reports delivered on or before deadline | 100% for regulatory submissions |
| Near-miss reporting rate | Volume of near-miss incidents reported per quarter | Trending upward over 12 months |
| Executive engagement score | Qualitative rating from board/exec team on report clarity | Above 4 out of 5 |
| Dashboard adoption rate | Percentage of risk staff accessing real-time dashboards weekly | Greater than 80% |
| KRI breach response time | Average time from KRI breach alert to documented management response | Under 48 hours |
Key risk indicators should map directly to your institution's stated risk appetite. If your appetite statement says credit concentration risk is a primary concern, you should have a KRI tracking concentration thresholds by sector and borrower type, reviewed on a frequency that matches how fast that exposure can shift.
Stakeholder feedback is often underused as a measurement tool. A short quarterly survey sent to board members and senior operational managers asking what the report answered well and what it left unclear generates qualitative data that no dashboard metric can replace.
Pro Tip: Track the ratio of risk insights that led to documented management action against total risk insights reported. Institutions that manage this ratio actively see consistent improvement in both reporting quality and organizational risk culture over time.
For institutions using real-time risk monitoring, system-level metrics such as data refresh frequency, alert accuracy, and false positive rates provide an additional layer of reporting quality verification that is impossible to obtain from periodic manual reports.
My perspective on risk reporting as a strategic asset
I have observed risk reporting in financial institutions from multiple vantage points, and the pattern I see repeatedly is this: institutions invest in technology before they invest in culture, and they pay for it.
A credit union that deploys an advanced dashboard platform before its staff trusts the reporting process will get a sophisticated system full of incomplete, selectively curated data. The output looks authoritative but conceals the actual risk picture. The technology did not fail. The culture did.
What I have found actually works is sequencing the effort deliberately. Fix the feedback loops first. Show operational staff that reports lead to decisions, that their inputs matter, and that surfacing a problem does not make them the problem. Once that trust exists, near-miss reporting rates climb, data quality improves, and the quantification models start producing outputs worth acting on.
I am also genuinely persuaded by the shift from heatmaps to financial quantification. I understand why heatmaps persist. They are fast to produce and easy to present. But capital allocation decisions deserve dollar-denominated inputs, not color gradients. The board is not making decisions about colors. They are making decisions about money. Risk reports should speak that language.
On AI and continuous reporting, I think the directional shift is irreversible and largely positive. But human judgment still determines which KRIs matter, how thresholds are set, and how findings get communicated to decision-makers. The AI advantage in risk management is speed and pattern recognition, not strategic interpretation. That part stays with you.
— Raj
Take your risk reporting further with Riskinmind
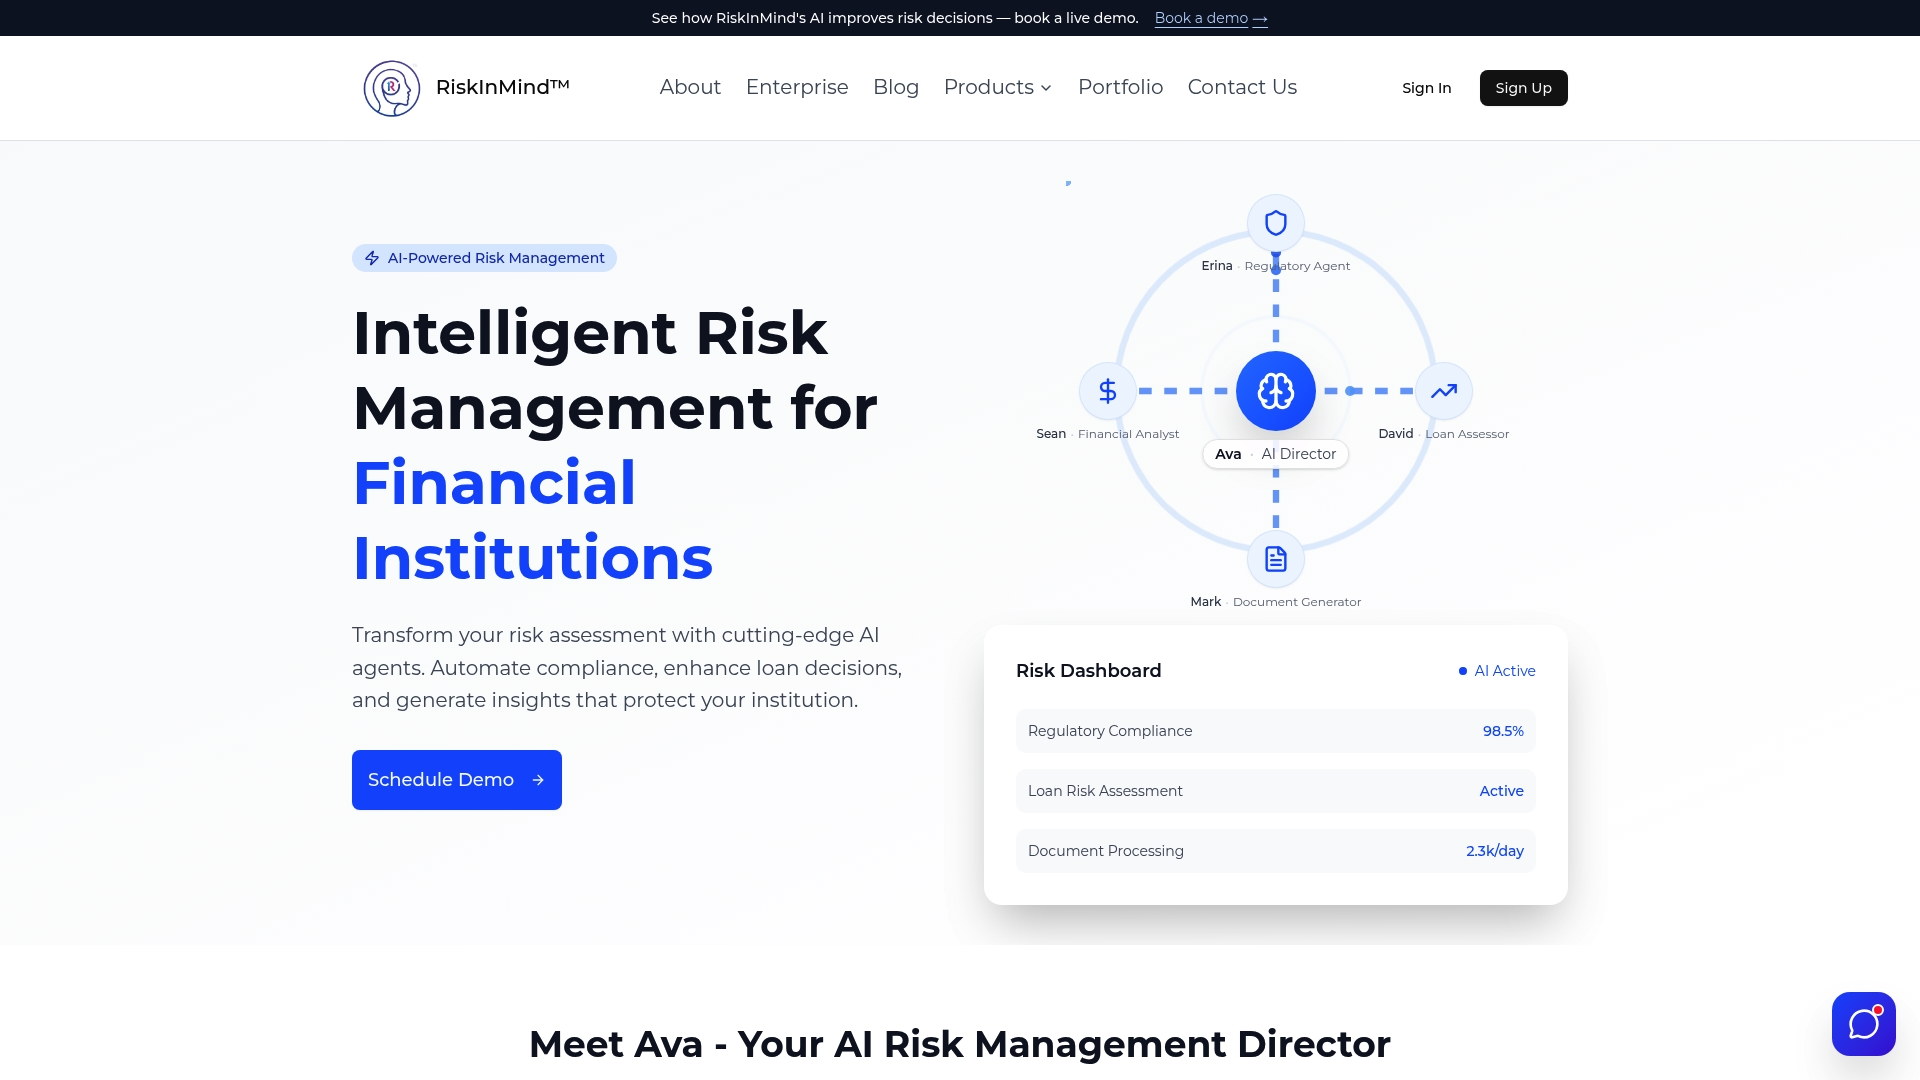
Riskinmind is built specifically for financial institutions that need more from their risk reporting than periodic spreadsheets and static PDFs. The platform's AI-powered risk management solutions automate data aggregation, generate real-time dashboards, and support financial quantification workflows that give your board the dollar-denominated risk clarity they need. Ava, the platform's central AI director, coordinates specialized agents across credit risk, regulatory compliance, and market analysis to keep your reporting accurate, timely, and decision-ready. Whether you are building out your first KRI framework or upgrading an existing reporting infrastructure, tools like the CRE Loan Risk Predictor and the peer benchmarking module give your team the quantitative depth and comparative context to produce reports that actually move the needle.
FAQ
What is the most common reason risk reporting fails?
The most common reason is a lack of feedback loops connecting reports to visible management decisions, which causes operational staff to lose confidence that accurate reporting matters and gradually reduces data quality.
How do you quantify risks for board-level risk reports?
Use Monte Carlo simulations applied to expert-calibrated frequency and severity estimates to produce dollar-denominated expected loss figures. A 15% probability of an $8M to $45M loss, for instance, yields a $4.2M expected annual loss that boards can evaluate against capital and risk appetite directly.
How long should a risk report be for executive leadership?
Executive risk reports should be under two pages, focused on top risks, emerging trends, and explicit decisions required. Dense technical detail belongs in operational-level appendices, not the executive summary.
What metrics indicate that optimized risk reporting is working?
Key indicators include near-miss reporting rates trending upward, KRI breach response times under 48 hours, dashboard adoption above 80% among risk staff, and qualitative executive feedback scores above 4 out of 5.
How does near-miss reporting improve overall risk visibility?
Near-miss incidents occur far more frequently than actual loss events and represent leading indicators of systemic vulnerabilities. Capturing and reporting them gives institutions a forward-looking risk picture that lagging incident data alone cannot provide.