
CRA compliance analytics converts lending, deposit, investment, and demographic data into examiner-ready evidence and ongoing performance monitoring. The top obligation to prepare for is agency reporting cadence, since examiners judge every metric in performance context rather than in isolation. The single priority for 2026: auditable, version-aware metrics paired with preserved source evidence that can be reproduced on demand.
TL;DR:
- CRA analytics systems must be version-aware and tag all metrics with the rule set used, to ensure accurate interpretation during overlapping assessments from 2024 to 2027.
- Building validation controls like automated field checks, geocoding logs, and source record retention is essential for examiner testing and maintaining data integrity.
- Institution asset thresholds and reporting obligations change yearly, requiring continuous threshold monitoring and precise classification to avoid compliance gaps.
- CR attribution should rely on accurate, geocoded loan and deposit data, with a separate tracking layer for community development activity to demonstrate community benefit.
- Running pilot tests using historical data helps validate geocoding accuracy, reproductive reporting, and export functionality before full implementation.
Maintain 100% NCUA & OCC Audit Readiness
Monitor regulatory updates 24/7, check internal credit policies, and generate compliance trails with Erina (AI Regulatory Agent).
Table of Contents
- U.S. CRA Regulatory Baseline: Thresholds, Timelines, and the 2026 Transition
- Core Data Inputs and Metrics CRA Analytics Must Produce
- Data Quality, Sampling, and Examiner Testing: Controls Your Analytics Must Support
- Analytics Workflow: Producing Examiner-Ready Evidence
- How to Evaluate Analytics Solutions and Run a Controlled Pilot
- In-House vs Vendor vs Hybrid: Choosing the Right Delivery Model
- Publisher Proof Points: How RiskInMind Maps to the CRA Analytics Checklist
- Integration of CRA Analytics With Overall Bank Risk Management
- Common Pitfalls and Compliance Risks in CRA Data Analytics
- Case Studies and Examples of Successful CRA Analytics Implementation
- Author Perspective: Practical Priorities for 2026 CRA Analytics Readiness
- Practical Next Step: Request a RiskInMind Pilot or Demo
- FAQ
- Sources
U.S. CRA Regulatory Baseline: Thresholds, Timelines, and the 2026 Transition
CRA applicability and oversight depend on which regulator supervises an institution. National banks and federal savings associations fall under the Federal Reserve, which oversees CRA for state-chartered member banks, while the FDIC supervises state nonmember banks. Each agency applies the same statutory framework but runs its own exam schedule and data submission process, so the first step in any analytics build is confirming which regulator's procedures govern the institution's reporting.
Asset-size thresholds determine whether an institution must report CRA data at all, and those thresholds move every year. For calendar-year 2025 data, FFIEC reporting criteria set the asset threshold at $1.649 billion, with the completed data due to regulators by March 1, 2026. Institutions near the line need to track the threshold annually rather than assuming last year's figure still applies, because a small asset shift can change reporting obligations entirely.
The bigger operational challenge for 2026 is the CRA rule transition itself. Final rule provisions phase in across 2024 through 2027, which means two methodologies can be in effect for overlapping evaluation periods. Interagency transition guidance makes clear that analytics systems must be version-aware, labeling which rule set produced each metric so a change in methodology never gets mistaken for a change in actual lending performance.
Practical implications for analytics teams building toward this transition:
- Confirm your regulator and asset category before configuring any reporting module, since thresholds and exam cycles differ by charter type.
- Tag every stored metric with the rule version that generated it, not just the reporting period, to avoid retroactive confusion during multi-year reviews.
- Build a threshold-monitoring routine that checks the current year's asset figure against the published limit each reporting cycle.
- Separate 2024 to 2027 transition-era data into clearly versioned tables so year-over-year comparisons remain defensible under either rule set.
Core Data Inputs and Metrics CRA Analytics Must Produce
CRA analytics only holds up under examination when it is built from the right raw inputs and produces the exact metrics examiners expect to see.
- Loan-level records covering small-business and small-farm loan fields, origination amounts, census tract, and revenue category for the borrower.
- HMDA data, where applicable, to cross-reference mortgage lending patterns against the same assessment areas used for CRA evaluation.
- Call Report data supplying balance sheet context, including total assets, which determines reporting thresholds and institution category.
- Deposit and branch data mapped to facility locations, since branch footprint defines part of the assessment area.
- Prior CRA evaluations and the institution's public file, which examiners reference to track performance trends across exam cycles.
From these inputs, analytics must calculate two core metric families. Geographic distribution measures how lending spreads across low-, moderate-, middle-, and upper-income census tracts within an assessment area. Borrower distribution measures how lending reaches businesses or farms by revenue size and individuals by income level. The OCC CRA examination procedures describe how these metrics get weighted across product lines, meaning a small-business lending component and a mortgage lending component do not simply average together; each carries its own weight toward the final rating.
Community development activity needs its own tracking layer, separate from retail lending metrics. Investments, grants, and services must be mapped to the specific assessment area they benefit, with documentation showing the community development purpose, not just the dollar amount. Our review of compliance testing programs covers how this validation layer typically fits into a broader exam-preparation workflow.
Data Quality, Sampling, and Examiner Testing: Controls Your Analytics Must Support
Examiners do not take reported metrics at face value. They test data integrity through structured sampling, and the thresholds for passing that test are specific enough to build directly into an analytics pipeline.
Federal Reserve sampling guidance describes a two-tier schedule: for a loan population of 150 files, examiners pull an initial sample of 29. If errors in key fields stay low, the exam proceeds on that sample. If errors exceed the threshold, the sample expands to 56 files, and persistent key-field errors can trigger a full resubmission of the affected data. Key fields typically include loan amount, census tract, revenue flag, and loan purpose, the same fields that drive geographic and borrower distribution calculations.
Controls that hold up against this kind of testing include:
- Automated field-level validation that flags census tract mismatches, missing revenue codes, or out-of-range loan amounts before submission.
- Human review of flagged exceptions, since automated checks catch format errors but not judgment calls like borrower classification disputes.
- Documented exception resolution, recording why a flagged record was corrected, excluded, or retained as-is.
- Geocoding decision logs that show which address-matching method placed a loan in a given census tract, since geocoding errors are a common source of key-field mismatches.
Pro Tip: Run your own internal sample at the same tier size examiners use, 29 out of 150 as a working example, before submission, so you catch the error rate that would trigger expansion before an examiner does.
Data lineage matters as much as the validation logic itself. Retaining source records, transformation scripts, and reviewer sign-offs means any reported figure can be traced back to its origin on request, which is exactly what FFIEC data integrity guidance expects institutions to be able to demonstrate.

Analytics Workflow: Producing Examiner-Ready Evidence
A repeatable workflow keeps CRA analytics defensible across reporting cycles and reduces the scramble that happens when an exam notice arrives.
- Define the rule version and institution category first, since this determines which metrics and assessment-area rules apply for the period in question.
- Inventory and govern source systems, confirming which systems of record feed loan, deposit, and HMDA data, and who owns each feed.
- Validate and geocode every loan record, resolving address-matching exceptions before any metric calculation begins.
- Version the assessment areas, distinguishing facility-based areas tied to branch locations from deposit-based areas used by institutions without a traditional branch network.
- Calculate core metrics, geographic distribution, borrower distribution, and weighted product-line scores, using the validated dataset.
- Compare results to peer aggregates and prior-period performance to surface shifts that need explanation before an examiner asks.
- Investigate outliers, documenting legitimate business reasons for any tract or borrower segment showing unusually low penetration.
- Assemble the evidence package, pairing calculated metrics with performance context and supporting documents.
Performance context deserves its own capture step rather than an afterthought. Examiner procedures list the records that belong in this layer: Call Report data, Uniform Bank Performance Report comparisons, prior evaluations, local demographic data, and notes from community contacts. Our regulatory reporting overview walks through how these context pieces typically get organized alongside standard reporting fields.
The final export should include calculation worksheets, summary tables by assessment area, and the underlying supporting documents examiners may request, all labeled with the rule version that produced them.
How to Evaluate Analytics Solutions and Run a Controlled Pilot
Vendor feature lists rarely tell you whether a platform will survive an actual exam. A controlled pilot using your institution's own historical data is the only reliable test.
Build the pilot around these test cases:
- Geocoding accuracy against a known set of historical loans where the correct census tract is already confirmed.
- Historical reporting reproduction, feeding in a prior year's submitted data and confirming the platform recalculates the same metrics that were actually reported.
- Sampling reproducibility, running the same 29-file or 56-file sample logic examiners use and comparing error flags to your own manual review.
- Examiner-ready exports, generating a full evidence package and checking whether every figure traces back to a source record.
Pro Tip: Score the pilot on reproducibility, not speed. A platform that recalculates last year's submitted numbers exactly is more valuable than one that processes faster but drifts from your historical figures.
Required capabilities beyond the basics include rule-version tagging, full audit trails down to the transformation step, exception workflows that route flagged records to a human reviewer, peer benchmarking against comparable institutions, and one-click evidence export. Watch for red flags during the pilot: a vendor who cannot explain how geocoding exceptions are resolved, a platform that cannot reproduce prior-year submitted totals, or an export function that drops supporting documentation. Any of these should delay a full rollout decision until resolved.
In-House vs Vendor vs Hybrid: Choosing the Right Delivery Model
The right delivery model depends on institution size, existing data engineering capacity, and how much audit exposure the compliance function is willing to carry internally.
Smaller institutions with limited data engineering staff generally do better with a vendor platform that already encodes examiner procedures, since building geocoding, sampling logic, and version control from scratch takes specialized skills that are hard to justify for a single annual reporting cycle. Larger institutions with dedicated data teams sometimes build in-house, particularly when CRA data needs to integrate tightly with proprietary risk systems. A hybrid model, vendor-provided core calculation engine with in-house data governance and review, fits many community banks and credit unions that want control over source data without maintaining a full analytics build.
Whichever model you choose, certain governance controls have to exist regardless:
- Version control tying every metric to the rule set and reporting period that produced it.
- Evidence retention long enough to cover multiple exam cycles, not just the current reporting year.
- Reviewer sign-offs documented at each stage from data validation through final metric calculation.
Near-term steps worth taking now: run a quick gap assessment comparing current data capabilities against the inputs and metrics covered earlier, scope a pilot using one full prior reporting year, and build a stakeholder list that includes compliance, data engineering, and whoever owns the examiner relationship.
Publisher Proof Points: How RiskInMind Maps to the CRA Analytics Checklist
We built our platform around the same checklist compliance teams need to satisfy examiners, with proof points a buyer can verify directly rather than take on faith.
- SOC 2® aligned controls and bank-grade security support the audit-trail and data-retention expectations covered above.
- Specialized AI agents, coordinated by a central AI director, handle regulatory compliance, credit risk assessment, and portfolio monitoring as distinct workstreams rather than one generic score.
- Sub-second real-time processing keeps validation and metric recalculation fast enough to support iterative pilot testing against historical data.
- Mobile access and dashboard reporting let risk and compliance leads review flagged exceptions outside the office.
During a pilot, ask us to export a full examiner-ready package, reproduce a weighted product-line metric from a prior reporting year, and show the underlying audit log for that calculation. Our fair lending monitoring resource is worth a read alongside this checklist, since geographic CRA data and fair-lending risk overlap more than most compliance calendars acknowledge.
Integration of CRA Analytics With Overall Bank Risk Management
CRA analytics works best when it is not siloed from the rest of a bank's risk program. The same geocoded loan data that feeds CRA metrics also informs fair-lending monitoring, since a census tract showing low lending penetration under CRA can be the same tract flagged for underwriting pattern review under fair-lending analysis. Treating these as separate data pulls wastes effort and risks inconsistent figures showing up in two different compliance reports.
Credit risk and portfolio monitoring teams benefit from the same discipline. Loan-level data validated for CRA reporting, accurate census tracts, clean revenue codes, confirmed loan purpose, is the same data portfolio risk teams use for concentration analysis and stress testing. Building one validated dataset that feeds both CRA reporting and broader portfolio risk review cuts duplicate reconciliation work and reduces the chance that an examiner finds inconsistent numbers between a CRA public file and an internal risk report.

Governance committees overseeing enterprise risk should treat CRA analytics output as a standing input rather than a once-a-year compliance exercise. Our bias testing playbook covers how geographic and borrower distribution patterns from CRA data commonly feed into broader fair-lending bias reviews, which is a natural extension point for any risk committee already reviewing portfolio concentration and underwriting consistency.
Common Pitfalls and Compliance Risks in CRA Data Analytics
The most frequent pitfall is treating assessment-area definitions as static. Facility-based and deposit-based assessment areas can change when a branch closes, a deposit base shifts, or an institution expands into new markets, and analytics that do not version these definitions will misattribute lending activity to the wrong area in a later review.
A second common failure is geocoding drift. Address-matching logic that worked for one year's address formats can silently misplace loans into incorrect census tracts the next year, especially after address standardization changes or annexations redraw tract boundaries. Without a geocoding decision log, there is no way to catch this before an examiner does.
Over-reliance on vendor dashboards without underlying traceability creates a different kind of risk. A platform that shows a clean compliance score but cannot show the source record behind each figure leaves an institution unable to answer a direct examiner question about how a number was derived.
Finally, teams frequently underestimate how much performance context documentation matters. A metric showing weak borrower distribution in a given tract means little to an examiner without supporting context, demographic comparisons, competitor presence, or documented community contacts, explaining why the number looks the way it does. Skipping that narrative layer turns a defensible result into an open question during the exam.
Case Studies and Examples of Successful CRA Analytics Implementation
A community bank preparing for its first exam under the new rule set generally benefits most from running a full historical reproduction exercise first: pulling the prior year's submitted CRA data, recalculating every metric with the new rule version applied, and comparing the two side by side. This surfaces exactly where the new methodology changes reported figures, which lets compliance staff prepare a clear explanation for examiners before the question comes up.
A credit union expanding into a new deposit-based assessment area illustrates a different pattern. Rather than waiting until year-end to calculate geographic distribution for the new area, the stronger approach is to run interim metrics quarterly, catching any geocoding mismatches in the new market early enough to correct source data before the full reporting cycle locks in.
A regional lender integrating CRA data with fair-lending review shows how shared infrastructure pays off. Once loan-level data is validated once for CRA reporting, the same clean dataset feeds fair-lending geographic analysis without a second validation pass, cutting duplicate reconciliation work and keeping the two reports numerically consistent when examiners from either discipline ask for supporting detail.
Author Perspective: Practical Priorities for 2026 CRA Analytics Readiness
The institutions that handle the 2026 transition well will be the ones that treat auditable evidence and version control as the starting point, not an afterthought, and that validate any analytics tool against their own historical data before trusting it with live reporting. CRA analytics belongs in the same governance conversation as fair-lending and geographic-risk review, never in a separate silo. A compliance score that cannot be traced back to a source record is not evidence. It is a guess with good formatting.
— Raj
Practical Next Step: Request a RiskInMind Pilot or Demo
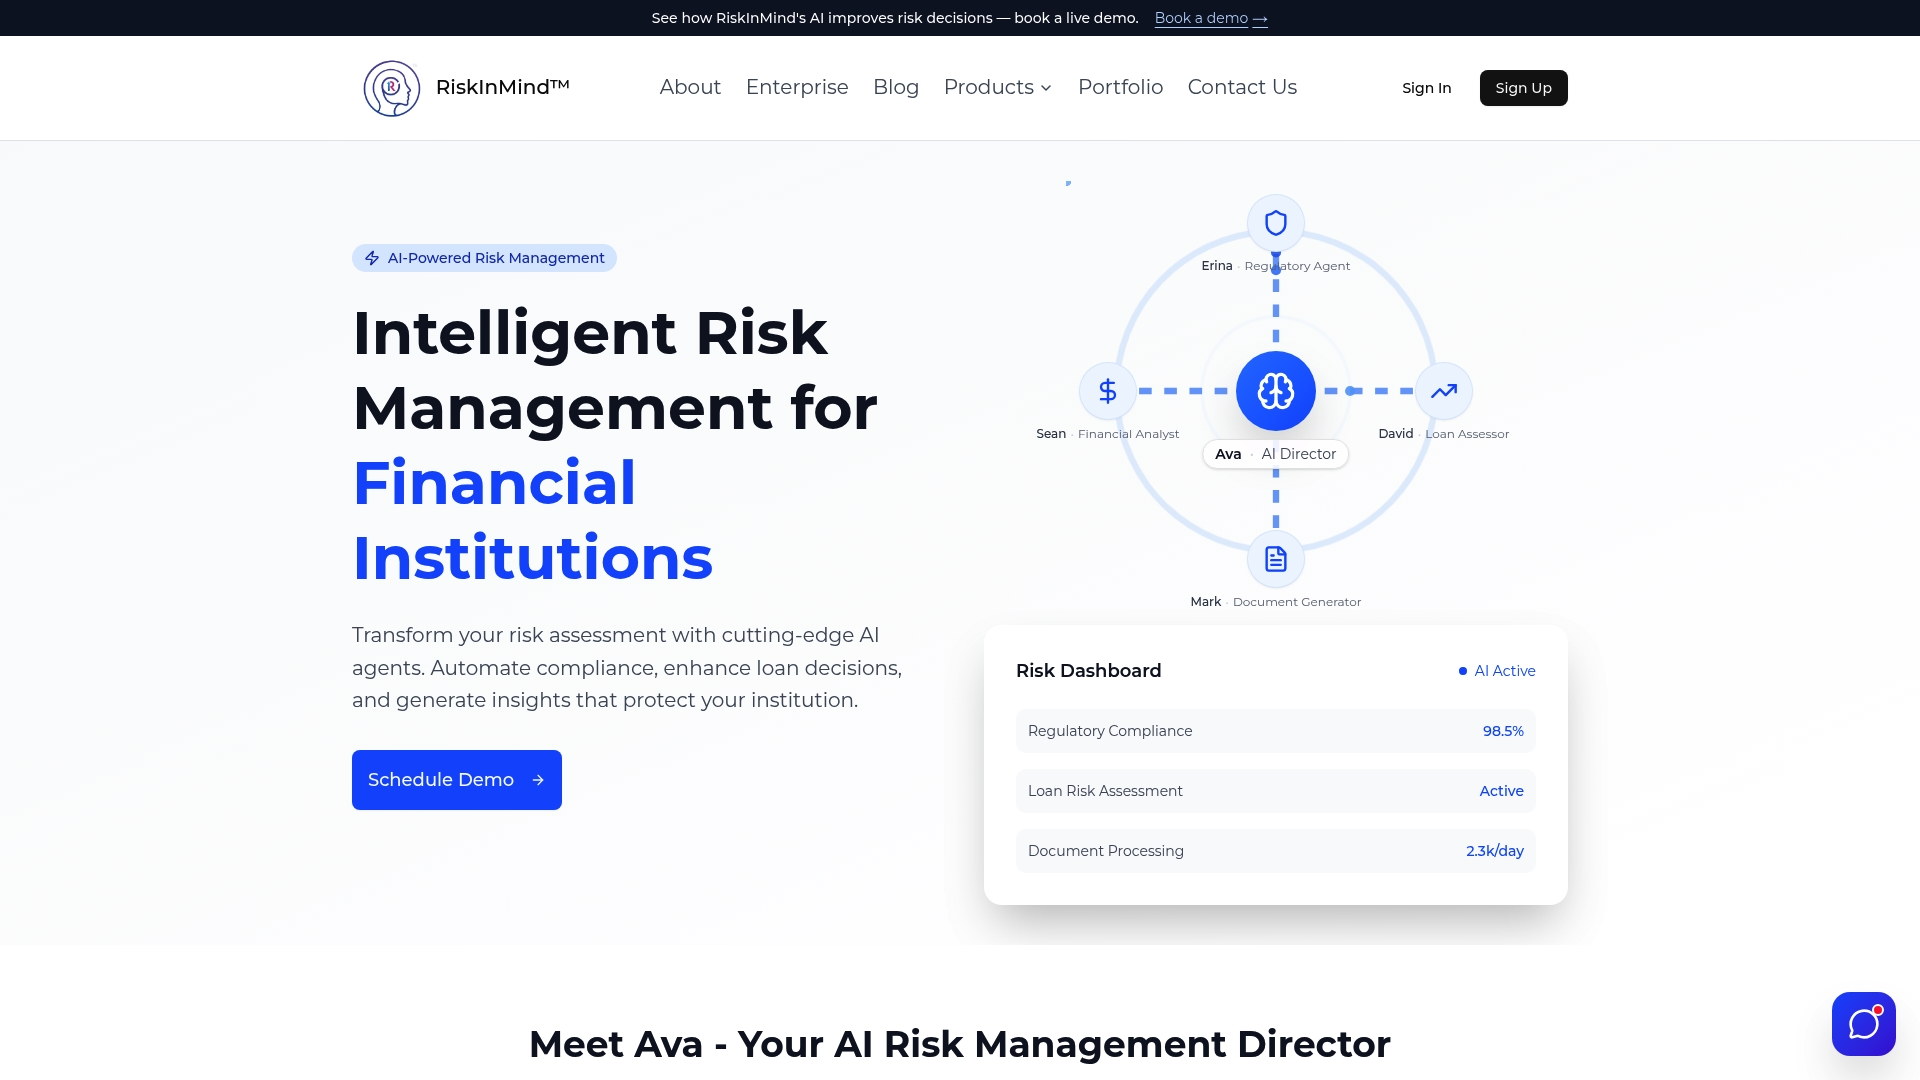
Our platform is designed to meet the checklist covered throughout this guide, and the fastest way to see whether it fits your institution is a scoped pilot rather than a sales deck. A pilot built around this article's checklist typically runs your prior reporting year through our system to confirm the numbers reproduce, then walks through a sample examiner export.
What a pilot with us delivers:
- An examiner-ready evidence package generated from your own historical loan data.
- A geocoding quality report flagging any census tract mismatches against your known records.
- A sample audit log showing the transformation path behind a calculated metric.
Compare plan fit on our Starter, Professional, and Enterprise pricing page, or explore the full platform at Riskinmind and request a pilot scoped to your next reporting cycle.
FAQ
What is CRA in the USA?
The Community Reinvestment Act is a U.S. federal law requiring covered depository institutions to help meet the credit needs of the communities they serve, including low- and moderate-income areas. The Federal Reserve's CRA overview explains that regulators evaluate this through periodic exams tied to lending, investment, and service performance.
What does "CRA compliance" mean?
CRA compliance means an institution can demonstrate, with traceable data, that its lending and investment activity meets community credit needs across its assessment areas. It covers accurate data reporting, documented performance context, and evidence that withstands examiner sampling and testing.
What does a CRA compliance officer do?
A CRA compliance officer oversees data collection, metric calculation, assessment-area definitions, and the documentation package an institution presents during an exam. The role typically coordinates with data engineering, fair-lending teams, and senior management to make sure reported figures match source records and performance context is properly documented.
Who needs to comply with CRA?
CRA applies to depository institutions insured by the FDIC, with reporting obligations scaled to asset size. The FFIEC reporting criteria set the specific asset threshold that determines which institutions must submit annual CRA data, and that threshold adjusts each year.
Why does the 2026 CRA transition matter for analytics?
The CRA final rule provisions phase in across 2024 through 2027, meaning different methodologies can apply to overlapping evaluation periods. Analytics systems need to tag each calculated metric with the rule version that produced it, so a methodology change never gets mistaken for an actual shift in lending performance.