
CECL modeling requires lifetime expected credit loss estimates built on historical experience, current conditions, and reasonable and supportable forecasts, with no single mandated method. Institutions should pick from loss-rate, roll-rate, vintage, discounted cash flow, or PD/LGD frameworks based on portfolio complexity, then document every assumption. Getting there means prioritizing segmentation logic, forecast provenance, quantified Q-factors, and a validation trail that can survive examiner scrutiny.
- Flexibility in CECL modeling methods allows institutions to choose loss-rate, roll-rate, vintage, DCF, or PD/LGD frameworks based on portfolio complexity; assumptions must be well-documented.
- Segmentation should be based on "similar risk characteristics" using factors like risk rating, collateral type, and vintage, with regular reassessment to reflect underwriting or portfolio changes.
- Reliable data requires loan-level history, macroeconomic forecasts, and, if necessary, proxy data for thin segments, with forecasts ideally anchored by documented correlation and gradual reversion strategies.
- Validation involves ongoing backtesting, sensitivity analysis, peer benchmarking, and strict change control, emphasizing documentation and governance across the model lifecycle.
- Implementing CECL should be viewed as a continuous process, involving clear scope, data cleanup, segmentation, method selection, governance, and early regulator engagement, avoiding reliance on disconnected spreadsheets.
Automate Regulatory Model Risk Governance
Examine models against 32 qualitative criteria and resolve risk Tiers with pre-deployment checklists per OCC 2011-12 guidelines.
Table of Contents
- What Does CECL Modeling Actually Require Under ASC 326?
- Which CECL Modeling Approach Fits Your Portfolio?
- How Should You Segment Loan Portfolios for CECL?
- What Data and Forecasts Support a Defensible CECL Estimate?
- How Do Q-Factors Fit Into CECL Compliance Requirements?
- What Do Examiners Look for in CECL Model Validation?
- What Are the Practical Steps to Implement CECL?
- How RiskInMind Supports Audit-Ready CECL Modeling
- Where CECL Modeling Programs Actually Go Wrong
- Get Audit-Ready CECL Modeling Without the Spreadsheet Sprawl
- Sources
What Does CECL Modeling Actually Require Under ASC 326?
CECL replaced the incurred-loss model with something fundamentally more forward-looking. Under ASC Topic 326, institutions no longer wait for a loss trigger event before recognizing it. They estimate the full lifetime expected credit loss on a financial asset the moment it lands on the balance sheet, using historical experience, current conditions, and reasonable and supportable forecasts.
That single shift changes the timing, the size, and the volatility of the allowance for credit losses. An incurred-loss allowance reacted to deterioration already visible in delinquency data. A CECL allowance has to anticipate deterioration that hasn't happened yet, based on where the economy and the portfolio are heading over a defensible forecast window. For most lenders, that means reserves move earlier and often land higher, particularly on longer-duration assets like auto loans, commercial real estate, and multi-year commercial and industrial credits.
Scope matters here too. CECL applies to financial assets measured at amortized cost, including loans held for investment, held-to-maturity debt securities, trade receivables, and certain off-balance-sheet credit exposures like unfunded commitments. Available-for-sale debt securities follow a separate impairment model under the same standard, so don't lump them into the same pool as your loan book when building your CECL reserve calculation.
The reasonable and supportable forecast period is where most of the technical debate happens. FASB never specified a fixed length. Institutions build their own forecast horizon based on the economic drivers relevant to their portfolio, then revert to long-run historical loss experience once the forecast becomes too uncertain to support. FASB staff Q&A guidance clarifies several of the trickier mechanics here, including how reversion should behave across different asset types and how weighted-average scenarios interact with the forecast period.
Regulators have been explicit that CECL doesn't hand institutions a rulebook for exactly how to model expected losses. The interagency FAQs issued jointly by the Federal Reserve, OCC, FDIC, and NCUA describe acceptable methods, segmentation expectations, and documentation standards, but they leave method selection to the institution. That flexibility is a gift and a trap in equal measure. It lets a $300 million credit union use a simpler approach than a $50 billion bank, but it also means examiners will ask you to justify every choice you made, not just point to a standard everyone else follows.
Credit unions have a dedicated resource worth bookmarking. The NCUA's CECL accounting standards page summarizes the standard in plain terms and links to preparation tools built specifically for credit union balance sheets, which tend to skew more consumer-heavy than community bank portfolios.
Which CECL Modeling Approach Fits Your Portfolio?
No regulator will tell you which method to use, and that's intentional. OCC Bulletin 2019-17 and the interagency FAQs both confirm that loss-rate, roll-rate, vintage, discounted cash flow, and PD/LGD methods are all acceptable, provided the method reasonably estimates lifetime losses and the assumptions are documented well enough for a third party to follow the logic.
Loss-rate methods apply a historical loss rate to a current balance, then adjust for the remaining life of the asset and expected forward conditions. They're the most common starting point for community banks and credit unions because they extend naturally from legacy allowance calculations. A loss-rate approach works well for homogeneous consumer pools like auto loans or unsecured personal loans, where the loss experience is reasonably stable and the population is large enough to produce statistically credible rates. The weakness shows up on longer-duration or heterogeneous portfolios, where a single historical rate stretched over the loan's remaining life stops reflecting how risk actually evolves.
Roll-rate and vintage methods track how balances migrate between delinquency buckets, or how a pool of loans originated in the same period performs over its lifecycle. Roll-rate models are strong for revolving products like credit cards and lines of credit, where delinquency migration patterns are the most informative signal available. Vintage analysis shines on installment products, small business loans, and consumer term loans, because it isolates how underwriting quality in a given origination period plays out over time, separate from macro noise.
Discounted cash flow (DCF) models project expected cash flows loan by loan or pool by pool, then discount them back at the loan's effective interest rate to arrive at a present value, with the CECL reserve equal to the shortfall against amortized cost. DCF is the right call when contractual terms, prepayment behavior, or interest rate features materially affect timing and size of cash flows, which is common in mortgage portfolios, long-term commercial loans, and any asset with embedded options like prepayment penalties or rate resets. It's also the heaviest lift, requiring documented assumptions on prepayment speed, curtailments, recovery timing, and discount rate mechanics.
PD/LGD frameworks separate the probability of default from the loss given default, then combine them with exposure at default to build an expected loss estimate. This granular structure suits commercial lending, large-exposure portfolios, and any book where borrower-level credit risk varies enough that a pooled loss rate would obscure real differences between individual credits. It demands more data and more modeling infrastructure than a loss-rate approach, which is why it tends to show up at larger banks with dedicated credit risk teams rather than smaller institutions.
Many mid-size and smaller lenders land on a hybrid: loss-rate or vintage for consumer pools, a simplified PD/LGD or risk-rating migration approach for commercial credits, and DCF reserved for a handful of complex or workout-status loans. That's defensible as long as the rationale for splitting methods by portfolio segment is written down, not just implied by spreadsheet structure.
Whatever you choose, examiners expect the same supporting package: a written methodology memo, a clear map from historical data to the chosen method's inputs, sensitivity testing showing how the reserve moves under alternative assumptions, and evidence that the method was actually appropriate for that segment rather than selected for convenience.
- Loss-rate: best for large, homogeneous consumer pools with stable historical performance
- Roll-rate: best for revolving credit where delinquency migration is the dominant signal
- Vintage: best for installment and term loans where origination-period underwriting matters
- DCF: best for long-duration or option-embedded assets like mortgages and structured commercial loans
- PD/LGD: best for commercial and large-exposure portfolios needing borrower-level granularity
Pro Tip: Don't force one method across your entire balance sheet just to simplify the model inventory. Examiners care far more about whether the method fits the segment's risk characteristics than about how many methodologies appear in your policy binder.
How Should You Segment Loan Portfolios for CECL?
Segmentation is where CECL modeling either holds up under review or falls apart. The standard calls for grouping assets with "similar risk characteristics," and the interagency FAQs point to factors like risk rating, collateral type, vintage, industry, term, and geography as reasonable starting points, without mandating a specific taxonomy.
In practice, most institutions start from Call Report loan categories because that structure is already familiar and reconcilable to regulatory filings, then refine from there. A community bank commercial portfolio might split Call Report's commercial real estate category further by property type, loan-to-value band, and originating vintage, because a construction loan and a stabilized multifamily property don't share the same loss drivers even though both sit in the same regulatory bucket.
The granularity question comes down to a tension every model owner eventually runs into: split segments too finely and you lose statistical credibility, because a pool with 40 loans can't produce a stable historical loss rate. Split them too broadly and you blend dissimilar risk into a single number that misrepresents both the safer and riskier loans inside it.
A few practical rules of thumb help navigate that tradeoff:
- Start with regulatory categories, then split further only where loss behavior demonstrably differs, not because a split seems intuitively reasonable.
- Require a minimum population size, often several hundred loans for consumer pools, before treating a segment's historical loss rate as statistically credible.
- Reassess segmentation whenever underwriting standards shift, a new product launches, or the institution enters a new geography or industry vertical.
- Track segment-level loss rates over multiple periods to confirm the pool behaves coherently rather than masking two distinct subpopulations.
- Document the rationale for every split and every consolidation, since examiners will ask why a segment was drawn the way it was, not just what the resulting number is.
Reassessment triggers deserve their own attention because segmentation isn't a set-it-once exercise. A bank that launches a new indirect auto channel, tightens commercial underwriting after a credit cycle, or acquires a portfolio through merger needs to revisit whether existing segments still reflect "similar risk characteristics" for the combined population. Treating segmentation as static is one of the more common gaps examiners flag during CECL model reviews.
Validation checks for segmentation coherence typically include comparing loss rate volatility within a segment against volatility across segments, running statistical tests for whether subgroups within a pool behave differently enough to warrant a split, and confirming that the segmentation used for CECL reasonably aligns with how the institution manages credit risk internally. If your risk committee talks about the portfolio one way and your CECL model segments it another way, that mismatch is exactly the kind of inconsistency an examiner will probe.

What Data and Forecasts Support a Defensible CECL Estimate?
CECL reserve modeling runs on two categories of data: loan-level historical performance and forward-looking economic inputs, and weak data in either category undermines the whole estimate regardless of how sophisticated the method looks.
On the historical side, you need loan-level origination data, payment history, delinquency status over time, charge-off and recovery amounts, collateral values where applicable, and enough history to span at least one full credit cycle if possible. Loss-rate and vintage methods need historical loss rates by segment and by vintage year. Roll-rate methods need delinquency bucket transitions at a monthly or quarterly cadence. PD/LGD frameworks need default events, exposure at default, and recovery timing at a borrower or facility level. DCF models need contractual cash flow schedules, prepayment history, and discount rate documentation.
Forecasting is where CECL modeling gets philosophically uncomfortable for a lot of risk teams, because it requires committing to a specific view of the future and defending it. Common macroeconomic drivers include unemployment rate, GDP growth, housing price indices, and industry-specific indicators for concentrated commercial portfolios. Many institutions license forecasts from established economic data providers rather than build proprietary models, which is acceptable as long as the source, vintage, and application of that forecast are documented clearly enough that a validator or examiner can trace exactly which forecast version fed which reporting period.
The reasonable and supportable period is institution-specific, and this is a place where documentation matters more than the specific number chosen. A bank might support a two-year forecast horizon for its consumer portfolio based on the correlation strength between unemployment and historical losses, then revert to a longer-run historical average for periods beyond that. FASB's own staff Q&A clarifies that reversion doesn't need to happen abruptly. A straight-line reversion over several quarters is generally more defensible than an instant cliff from forecast to historical average, since an abrupt jump is harder to justify economically.
Missing or thin data shows up constantly at smaller institutions, particularly newer product lines or recently entered markets with no internal loss history. The interagency FAQs confirm that institutions can use peer data, industry benchmarks, or proxy portfolios with similar risk characteristics when internal history is insufficient, provided the substitution is documented and adjusted to reflect actual differences between the proxy and the institution's own book.
- Loan-level origination, payment, delinquency, charge-off, and recovery data spanning multiple years
- Macroeconomic forecast inputs with documented source, vintage, and update frequency
- A written reasonable and supportable period rationale tied to correlation strength between drivers and losses
- A reversion methodology, ideally gradual rather than a hard cutoff
- Proxy or peer data sources for thin segments, adjusted and documented for known differences
Reasonable and supportable forecasts aren't optional window dressing. Regulators expect the forecast horizon itself, not just the historical loss rate, to carry real analytical weight in the final reserve number, which is exactly why Federal Reserve guidance devotes so much of its FAQ content to forecast mechanics rather than method selection alone.
How Do Q-Factors Fit Into CECL Compliance Requirements?
Qualitative factors exist to capture risk that historical data and quantitative models can't fully reflect on their own, whether that's emerging concentration risk, underwriting changes too recent to show up in loss history, or macro conditions moving faster than the model's forecast inputs can absorb.
Common Q-factor categories include changes in lending policies or underwriting standards, shifts in the nature and volume of the portfolio, changes in the experience or depth of lending management, trends in the volume and severity of past-due loans, and the effect of external factors like competition or legal and regulatory environment changes. Every one of these needs a specific trigger and a specific magnitude, not a vague "we adjusted up because things feel riskier."
The practitioner consensus on Q-factors has shifted toward quantification wherever possible. Rather than applying a judgment-based basis point adjustment with no supporting math, stronger practices tie overlays to observable indices. Protiviti's guidance on qualitative overlays describes approaches like benchmarking against peer institution overlay levels, building a neutralizing index that isolates the specific driver from other correlated factors, or scaling the adjustment to a measurable change in a leading indicator like early-stage delinquency migration.
Governance around Q-factors matters as much as the calculation method. Every overlay needs a documented approval process, typically running through a model risk committee or CECL governance committee, a defined threshold for when an adjustment gets added or removed, and a sunset review so overlays don't quietly become permanent fixtures long after the condition that justified them has resolved. An overlay added during a 2020-style shock that's still sitting on the books three years later with no updated justification is a near-guaranteed examiner finding.

Regulators generally accept Q-factors as a legitimate part of CECL reserve modeling, but they watch closely for overlays that consistently move in one direction, overlays that lack any quantitative anchor, and overlays whose combined effect starts to dominate the quantitative model's output rather than supplementing it. Tracking the variance between modeled losses and actual realized losses over time is the clearest evidence you can offer that your Q-factor framework is calibrated rather than arbitrary, and it's exactly the kind of variance analysis examiners ask to see during a review.
What Do Examiners Look for in CECL Model Validation?
Validation is the difference between a CECL model that looks reasonable on paper and one that survives a full examination cycle. The interagency Policy Statement on Allowances for Credit Losses lays out supervisory expectations that apply across banks and credit unions regardless of size, and it treats validation as an ongoing discipline rather than a one-time checkbox before go-live.
A complete validation program covers conceptual soundness review, confirming the chosen method fits the portfolio and the assumptions are theoretically justified; backtesting, comparing modeled loss estimates against subsequent actual performance; sensitivity and scenario analysis, showing how the reserve responds to plausible alternative economic paths; and benchmarking, comparing results against peer institutions or alternative model specifications to sanity-check outputs.
Ongoing monitoring picks up where initial validation leaves off. That means drift detection to catch when a model's predictive relationships start decaying, formal variance analysis between the allowance booked and losses actually realized, and a cadence for reporting model performance to the board or a designated risk committee. A model that passed validation eighteen months ago but hasn't been re-tested against a full economic cycle since is a legitimate governance gap, not a technicality.
Internal controls round out the picture. Change control matters enormously here: every adjustment to segmentation, assumptions, or Q-factors should run through a documented approval workflow with version history, not a spreadsheet edit that nobody can trace back later. Segregation of duties between model developers, validators, and the staff approving the final reserve number reduces the risk that errors or biased judgment calls go unchecked. A complete audit trail, from raw loan-level data through to the final journal entry, needs to hold up to a walkthrough by someone who wasn't involved in building the model.
Examiners consistently focus on a handful of areas: whether segmentation logic is documented and periodically reassessed, whether the reasonable and supportable forecast period has real analytical support rather than a round number picked for convenience, whether Q-factors are quantified and time-bound rather than open-ended, and whether the institution can demonstrate that model outputs get challenged internally before reaching the board. The most frequent shortcoming isn't a bad model choice. It's a good model with thin documentation that can't answer the question "why did you do it this way" without someone reconstructing the logic from memory.
- Conceptual soundness review confirming method fit and assumption justification
- Backtesting against realized losses on a recurring schedule
- Sensitivity and scenario testing across plausible economic paths
- Peer or alternative-model benchmarking
- Documented change control with full version history
- Segregation of duties between model build, validation, and approval
Pro Tip: Build your variance analysis between allowance and realized losses as a standing quarterly report, not a one-off exercise you assemble only when an examiner asks for it. Institutions that already have that trend line ready tend to have far shorter, calmer exam conversations about model performance.
What Are the Practical Steps to Implement CECL?
CECL implementation strategies work best when treated as a sequenced program rather than a single modeling project, because data cleanup, governance, and reporting integration all take longer than the actual model-building step.
- Scope the transition. Inventory every financial asset subject to ASC 326, confirm which are already covered by existing allowance processes, and identify gaps in current data or infrastructure.
- Cleanse and assemble historical data. Pull loan-level performance history, reconcile it against Call Report and general ledger balances, and fix data quality issues before they get baked into a model.
- Design segmentation. Group assets by similar risk characteristics, starting from regulatory categories and refining based on documented loss behavior differences.
- Select methods by segment. Match loss-rate, roll-rate, vintage, DCF, or PD/LGD approaches to each segment's characteristics and data availability, documenting the rationale for each choice.
- Build and validate the model. Run conceptual review, backtesting, and sensitivity analysis before relying on outputs for financial reporting.
- Establish governance. Set up a CECL committee or extend an existing model risk committee's mandate to cover ongoing oversight, Q-factor approval, and sunset review.
- Integrate reporting. Map model outputs to Call Report Schedule RC-C and RC-N fields, financial statement disclosures, and any internal risk dashboards used by the board.
- Coordinate with auditors and examiners early. Walk external auditors and your primary regulator through methodology choices before year-end, not after a finding surfaces.
The most common pitfalls tend to repeat across institutions of every size: data gaps in early-history periods that force reliance on shorter lookback windows than the model ideally needs, Q-factor overlays added during a stressful quarter with no documented sunset plan, and version control failures where a spreadsheet-based model gets modified without a clear audit trail of who changed what and why. Each of these is preventable with process discipline rather than additional technology spend, though the right platform makes that discipline far easier to sustain.
Smaller and resource-constrained institutions shouldn't feel pressure to replicate the modeling sophistication of a top-20 bank. A well-documented loss-rate or vintage approach extended reasonably to a lifetime basis, with clear assumptions and a defensible reasonable and supportable period, holds up fine under examination. Complexity for its own sake isn't a compliance requirement, and a simple model with excellent documentation will outperform a sophisticated model with weak governance every time an examiner sits down with it.
How RiskInMind Supports Audit-Ready CECL Modeling
Institutions running CECL reserve modeling on spreadsheets eventually hit a wall where segmentation logic, forecast versions, and Q-factor history live in disconnected files with no single audit trail. Riskinmind's platform is built to close that gap by ingesting loan-level history directly, running loss-rate, roll-rate, vintage, or PD/LGD calculations depending on the segment, and preserving every assumption change in a traceable record rather than a buried spreadsheet edit.
The platform's specialized AI agents, coordinated by a central director called Ava, handle distinct pieces of the CECL workflow: one focused on credit risk assessment and segmentation logic, another on regulatory documentation, producing disclosure-ready outputs formatted for financial statement footnotes and Call Report alignment. Riskinmind holds SOC 2® certification and processes data with sub-half-second response times, which matters when a validator or examiner wants a scenario re-run on the spot rather than a follow-up email three days later.
A typical workflow moves from segmentation, where the platform applies documented risk-characteristic groupings, through method-specific modeling, then Q-factor overlay application with quantified triggers, into validation checks and finally a reporting layer that generates audit-ready output. The platform accelerates every one of those steps, but the institution still owns the modeling decisions, the assumption choices, and the final validation sign-off. Technology strengthens governance here. It doesn't replace it.
Where CECL Modeling Programs Actually Go Wrong
The institutions that struggle most with CECL rarely struggle because they picked the wrong method. They struggle because they treated the model as a one-time build instead of a living program that needs the same discipline in year four as it got in year one.
Data quality is the foundation everyone underestimates. A model built on five years of clean loan-level history will outperform a more elegant model built on three years of patchy data every single time an examiner tests it against realized losses. I'd rather see a bank run a simple loss-rate method on excellent data than a sophisticated PD/LGD framework on data full of gaps papered over with assumptions.
Board and senior management oversight is the second place programs quietly fail. CECL isn't a risk department project that gets reported up as a summary slide once a quarter. It needs cross-functional ownership spanning credit risk, finance, and audit, with the board asking pointed questions about forecast assumptions and Q-factor rationale, not just approving a final number.
The last piece is resiliency. Models built for a stable economic environment tend to break exactly when institutions need them most, during a rate shock or a regional downturn. Model risk research from the Philadelphia Fed makes a strong case that nimble, well-segmented models paired with parsimonious statistical methods hold up better under regime change than complex models optimized for a benign environment. Build in an escalation plan now for how you'll re-estimate quickly when the next shock hits, because you won't have time to design that process after it starts.
— Raj
Get Audit-Ready CECL Modeling Without the Spreadsheet Sprawl
Riskinmind gives institutions a faster path to a defensible reserve number than rebuilding CECL logic across disconnected spreadsheets every quarter, with segmentation, method selection, and Q-factor documentation running inside one traceable system instead of scattered files that break down under examiner scrutiny.
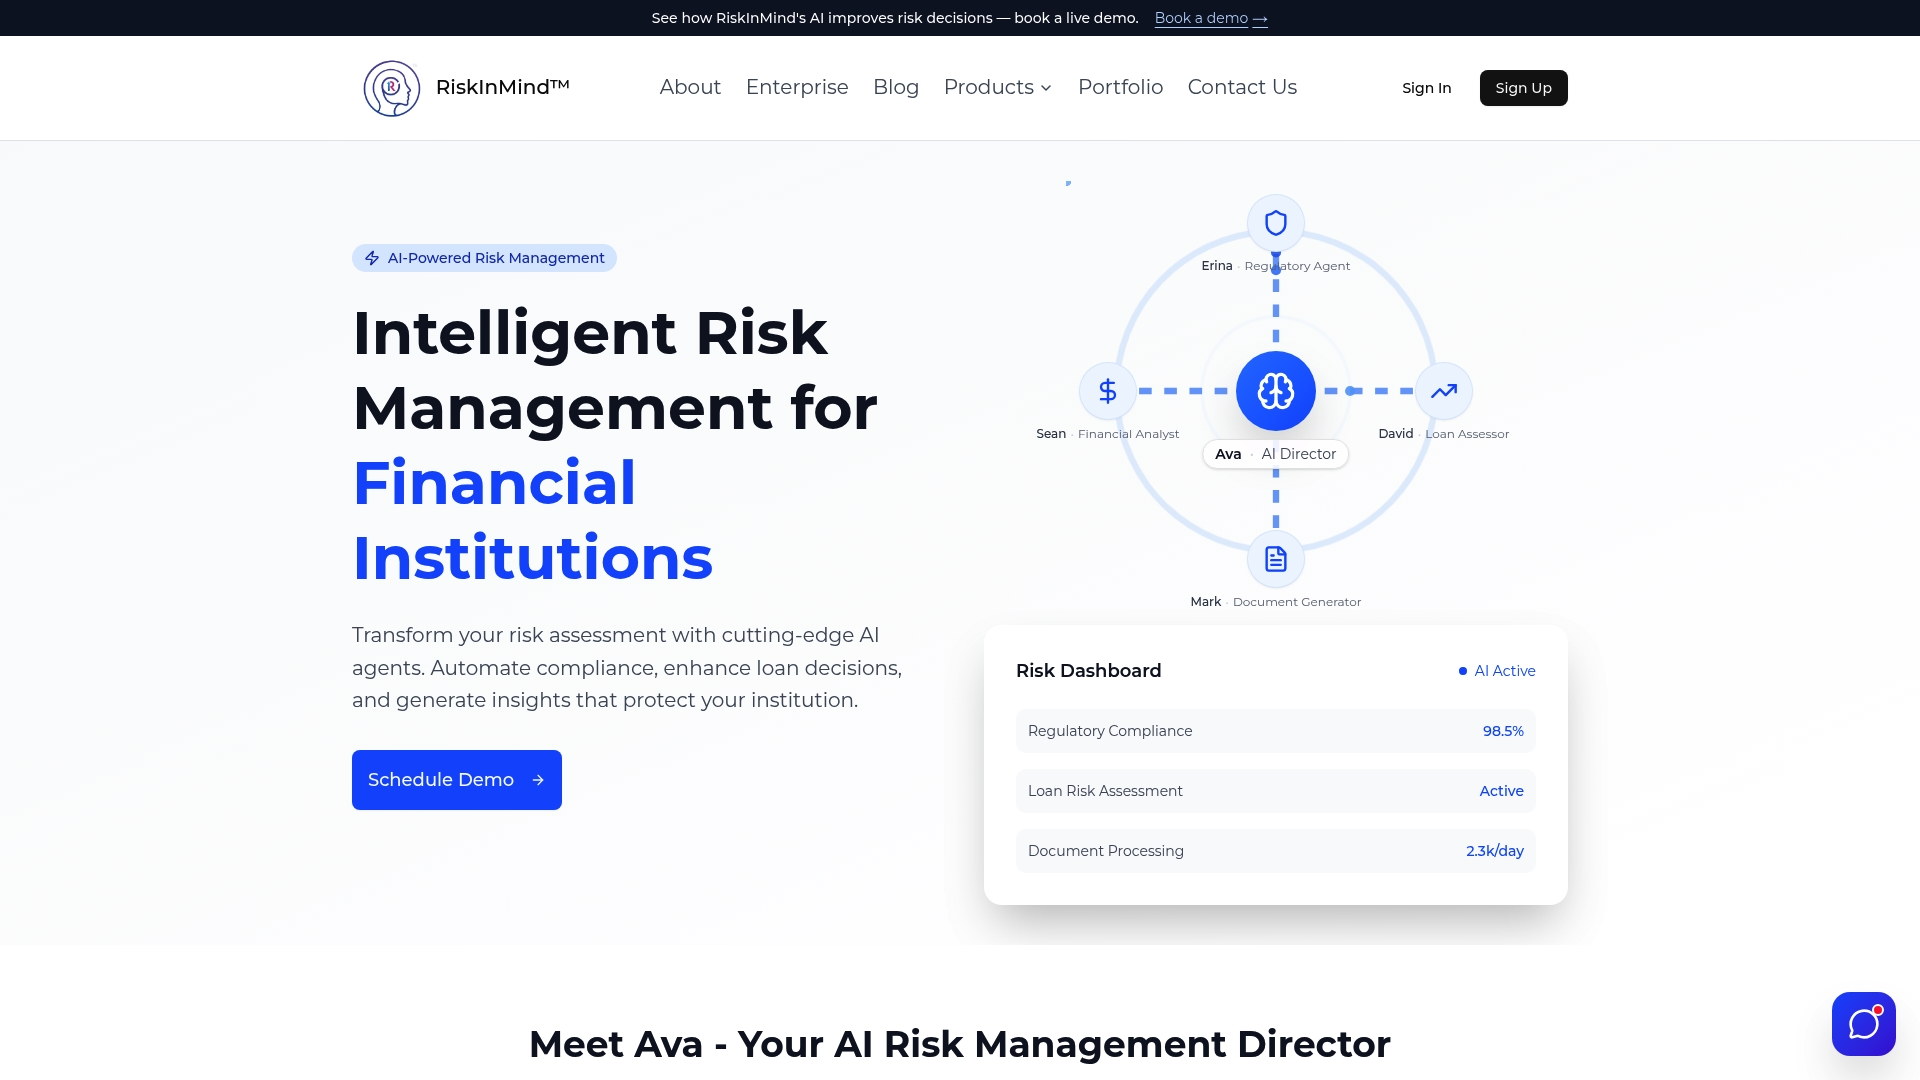
The platform supports the full CECL workflow: risk-characteristic segmentation, forecast-driven modeling across loss-rate, roll-rate, vintage, DCF, and PD/LGD approaches, quantified Q-factor overlays with sunset tracking, and disclosure-ready reporting mapped to Call Report fields. Riskinmind's SOC 2® certification and sub-half-second processing mean validation teams and examiners get answers to scenario questions in real time rather than waiting on a rebuilt spreadsheet. For institutions comparing automated approaches against manual underwriting and legacy loan origination systems, the difference shows up most clearly at reporting time, when a documented audit trail replaces hours of reconstructing assumption history by hand. Portfolio managers can also lean on peer benchmarking tools to stress-test reserve levels against comparable institutions before an examiner asks the same question.
If your CECL program is still running on quarterly spreadsheet updates and manual documentation, request a Riskinmind demo to see how segmentation, modeling, and reporting come together in one audit-ready platform built for exactly this workflow.
Sources
- ASU 2016-13, Topic 326 (FASB)
- Frequently Asked Questions on the Current Expected Credit Losses Methodology (Federal Reserve)
- Model Risk under CECL: A Consumer Finance Perspective (Philadelphia Fed working paper)
- CECL Accounting Standards (NCUA)