
Risk automation ROI is the net financial benefit of automating underwriting, compliance, and portfolio monitoring, divided by the full cost of getting and running the automation. The formula is simple. The discipline is in what you count: only benefits tied to a financial or operating measure belong in the numerator, and every cost, including internal time, belongs in the denominator. This guide walks through the cost and benefit categories, a worked example for a mid-sized credit union, the time horizon to use, and what a percentage such as 10% or 37% actually tells a board.
TL;DR
- ROI = (total benefits minus total costs) ÷ total costs, measured over a defined horizon, not a single year.
- Count only benefits you can link to a financial or operating measure: cash cost removed, losses avoided, revenue collected, capacity genuinely redeployed.
- Include licenses, implementation, data preparation, training, ongoing administration, and the internal time your own staff will spend.
- Model three to five years, apply realization and attribution haircuts, and treat any single ROI percentage as a scenario, not a promise.
- Adoption is the most common reason a projected return fails to appear, so budget for workflow change.
Maintain 100% NCUA & OCC Audit Readiness
Monitor regulatory updates 24/7, check internal credit policies, and generate compliance trails with Erina (AI Regulatory Agent).
Table of Contents
- What ROI means when the process is risk
- The costs to put in the denominator
- The benefits worth counting, and how to measure them
- A worked example for a credit union
- What an ROI percentage tells you
- Choosing the time horizon and payback measure
- What erodes the return
- Our perspective on risk automation ROI
- Putting the model to work with RiskInMind
- FAQ
- Sources
What ROI means when the process is risk
Risk processes are awkward to value because much of the benefit is a loss that did not happen. A faster credit memo is easy to price. A delinquency you avoided because a portfolio signal surfaced earlier is harder, and a regulatory finding you never received is harder still.
A useful starting rule comes from a 2026 Matchpoint Partners paper on AI adoption economics in financial services: build each use case around an accepted economic outcome, set it against a comparable baseline, and apply adoption, quality, realization, and attribution factors so the benefit is credibly tied to a financial or operating measure. The same paper stresses that generated outputs and notionally saved hours are only intermediate quantities. They do not prove realized value until they connect to a specific measure, such as reduced overtime, fewer outsourced reviews, or lower charge-offs.
In practice, that means separating five kinds of value in your model:
- Capacity released: hours your team no longer spends on spreading financials, drafting memos, or assembling exam binders.
- Cash cost removed: outsourced reviews, contractors, or overtime that actually stop.
- Revenue collected: loans decisioned faster, fewer applicants lost to slow turnaround.
- Losses avoided: lower charge-offs or fraud losses attributable to better screening and monitoring.
- Capital and reserve effects: more precise reserve modeling and better capital allocation.
Hours are only worth money when they are redeployed to revenue work or when they displace a real expense. An analyst who saves ten hours a week and spends them on the same queue has created capacity, not savings. Your model should say which one it claims.
The costs to put in the denominator
Most disappointing ROI figures come from an incomplete cost side. The ISACA Journal framework for estimating the ROI of automated internal controls lists the components: hardware and supporting software, annual software licenses for the automated controls, initial implementation, ongoing maintenance, and training. It is a 2011 piece, so treat its structure as durable and its technology assumptions as dated. Cloud delivery, for example, changes the hardware line considerably.
For a modern AI platform, a practical cost sheet looks like this:
| Cost category | Type | What to capture |
|---|---|---|
| Subscription or license | Recurring | Tier, seats or usage, contract term, renewal uplift |
| Implementation and configuration | One-time | Vendor services, your project team, policy and template setup |
| Data preparation and integration | One-time, then maintenance | Core system and loan origination connections, document and data cleanup |
| Training and change management | One-time, then onboarding | Staff time in training, new-hire onboarding |
| Administration and oversight | Recurring | Model governance, user administration, human review of outputs |
| Internal implementation capacity | One-time | Your IT, compliance, and credit staff hours, even with no cash outlay |
Integration and data preparation deserve a wide range in your model. Their cost scales with how fragmented your legacy systems and documents are, so two institutions of the same size can see very different numbers. Get the vendor to scope this explicitly before you commit to a figure.
Keep internal time visible. Staff hours on implementation rarely generate a purchase order, which is exactly why they vanish from business cases and then reappear as a delayed go-live.
The benefits worth counting, and how to measure them
The Mortgage Bankers Association white paper on evaluating risk and quality control tech stacks separates direct ROI factors (costs saved, time saved, better results) from indirect ones (adoption, learning curve, administration, compliance, morale, and reputation). It also notes that reputational risk is often overlooked yet can be highly destructive, so it belongs in the assessment of automated systems.
Map each benefit to a metric you already track:
- Speed: application-to-decision time, credit memo turnaround, days to complete a periodic review.
- Cost: cost per loan originated, cost per file reviewed, outsourced review spend.
- Loss rates: delinquency roll rates, charge-offs, fraud losses on submitted documents.
- Capital efficiency: reserve accuracy, concentration visibility, capital held against risk that was mismeasured.
- Compliance effort: hours to prepare exam and audit evidence, number of repeat findings.
The KPMG 2026 paper on risk transformation frames the scorecard in similar terms: cost, speed, loss rates, and capital efficiency. It also recommends launching high-impact quick wins, such as automating reporting, early so they begin to fund the larger transformation.
One caution on compliance. It is tempting to book a hypothetical fine as a certain saving. Resist it. Use explicit outcome measures for control quality and traceability instead: exceptions caught before an exam, evidence retrieval time, the share of controls tested automatically. The ISACA framework offers a concrete example: automated controls can cut Sarbanes-Oxley testing effort from about 50 hours per year to under 10 hours per year per control. That is a measurable hours figure you can price, which is far stronger than an imagined penalty.
The same ISACA framework makes a quieter point that matters for smaller institutions. Because automated controls are standardized and reusable, they let you extend monitoring to processes that were too expensive to watch manually. That is risk coverage you could not previously buy at any price, and it is legitimate value, though it is harder to put a dollar figure on.
A worked example for a credit union
The figures below are placeholders chosen to show the mechanics. They are not RiskInMind pricing and not a benchmark. Replace every line with your own baseline.
Assume a credit union with a $400 million loan portfolio evaluating an automated underwriting, memo generation, and monitoring platform over three years.
Annual benefits, after haircuts
| Benefit | Gross value | Realization or attribution | Counted value |
|---|---|---|---|
| Analyst capacity released (5,000 hours at a $48 loaded rate) | $240,000 | 60% redeployed or displaced | $144,000 |
| Charge-off reduction (10 basis points on $400M) | $400,000 | 25% attributable to the platform | $100,000 |
| Exam and audit preparation (800 hours at $60) | $48,000 | 75% realized | $36,000 |
| Total annual benefit | $280,000 |
Costs
- One-time: $90,000 implementation and integration plus $15,000 training, for $105,000.
- Recurring: $120,000 subscription plus $30,000 administration and oversight, for $150,000 per year.
Three-year result
- Total benefits: $840,000.
- Total costs: $105,000 + (3 × $150,000) = $555,000.
- Net benefit: $285,000.
- ROI: $285,000 ÷ $555,000 = 51%.
Year one nets only $25,000 ($280,000 minus $150,000 minus $105,000), and years two and three net $130,000 each. If benefits began on day one, payback would land around the tenth month ($105,000 of one-time cost against roughly $10,800 of monthly net recurring benefit). A realistic ramp, where staff adopt the tools over a quarter or two, pushes that later. Run it both ways.
Notice what drives the answer. Cutting the charge-off attribution from 25% to 10% removes $60,000 of annual benefit and drops three-year ROI to roughly 9%. The loss line is the most valuable and the least certain, which is why it carries the heaviest haircut. Show your approval committee that sensitivity rather than a single number.

What an ROI percentage tells you
Readers often ask whether 10% ROI is good, or whether 37% is. A percentage alone is not good or bad. Three things give it meaning.
The horizon. A 51% return over three years is roughly 17% a year on a simple basis. A 37% return over one year is a different animal. Always state the period next to the percentage.
The hurdle rate. Compare against what the institution requires of any capital project, or against what it could earn on the same funds. A 10% three-year return does not clear most hurdles. A 10% annual return might, depending on your cost of capital.
The confidence behind it. Matchpoint Partners recommends a confidence-weighted net present value to allocate capital, which discounts benefits by how certain they are. Two projects with the same headline ROI are not equal if one rests on cash costs removed and the other on avoided losses.
A workable reading for committees: a return supported mostly by hard cost removal and collected revenue needs a lower percentage to be convincing than a return built mainly on estimated loss avoidance. Report the share of benefits in each bucket next to the total.
Choosing the time horizon and payback measure
One year understates automation, because implementation costs land early and adoption takes time. Ten years overstates certainty, because the technology and your regulatory environment will change. The ISACA framework models a 10-year cash-flow statement, with its illustrative case showing a 30-month break-even period and a 94% internal rate of return. Those figures describe a specific 2011 example of automated controls, not what you should expect today, but the structure is sound: initial investment and recurring costs against benefits, year by year.
For an AI platform, a three to five-year model with year-by-year cash flow is the defensible middle. Report three outputs: cumulative net benefit, payback month, and NPV at your hurdle rate. If your vendor or an advisor quotes a payback figure, ask for the cash-flow table behind it.
What erodes the return
The MBA paper identifies the main threats: poor user adoption, difficulty changing workflows, vendor customization costs, learning-curve costs, and ongoing administration. Each one has a practical counter.
- Adoption: name an owner in credit and an owner in compliance, set usage targets for the first 90 days, and track them as seriously as you track go-live.
- Workflow change: automate the process as redesigned, not the old one. Policy exceptions and manual handoffs that are digitized unchanged keep their cost.
- Customization: fix scope in writing. Templates, policy rules, and report formats are where change orders accumulate.
- Integration variability: get the integration estimate from a scoping exercise, not a sales deck.
- Borrowed baselines: Matchpoint Partners cautions that external surveys and annual reports should inform scenarios and use cases, not stand in for your own baseline and realization data. Measure your own cycle times and loss rates before the project starts. Without a before, there is no ROI after.
Also keep a record of what the platform is not claimed to do. If a benefit depends on a regulator accepting a new evidence format, mark it as conditional.
Our perspective on risk automation ROI
We build for credit unions, community banks, and lenders, and we see the same pattern in business cases. The cost side is underestimated because internal time and data preparation are not on an invoice. The benefit side is overestimated because saved hours get booked as saved dollars.
We would rather see an institution adopt a conservative model and beat it. Start with the process where your baseline is cleanest, usually loan underwriting and credit memo production or recurring regulatory reporting, and prove the return there. Then extend into portfolio monitoring and reserve modeling, where benefits compound because the same data and controls serve several use cases.
Security is part of the return, not a separate line. If a tool requires sending borrower data to outside parties, the diligence, contract, and examiner conversations all add cost and risk. That is why our platform is built around in-house AI with no third-party data exposure, SOC 2® aligned controls, and granular audit trails. Audit-ready evidence that is produced as a by-product of the work is the cheapest compliance evidence there is.
For deeper reading on the pieces of this model, our articles on risk platform ROI examples and what risk software costs for banks and lenders cover the numbers in more detail, and our overview of risk process automation explains where to begin.
— Raj
Putting the model to work with RiskInMind
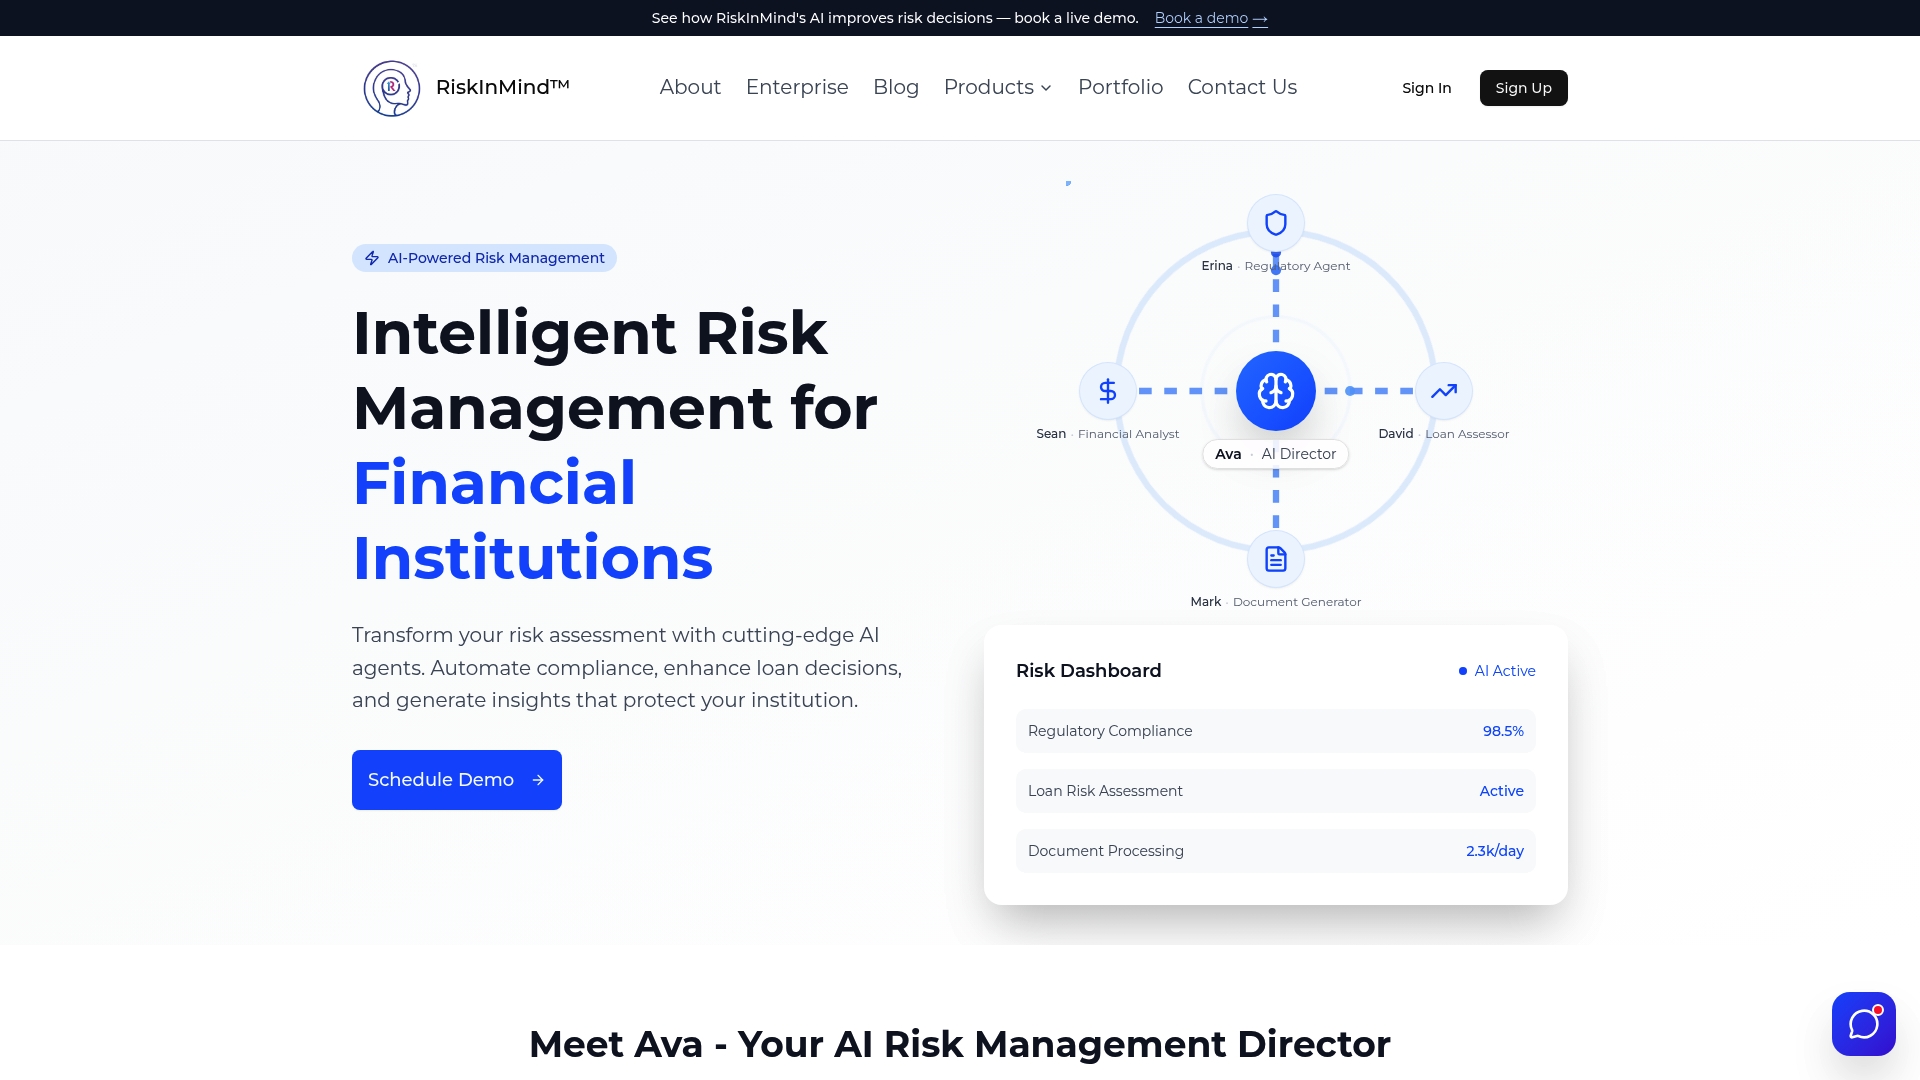
If you are building the business case now, the fastest way to replace placeholders with real inputs is to see the workflow on your own files. RiskInMind is an AI risk management platform for financial institutions, with specialized agents for credit risk assessment, regulatory compliance, and market analysis, coordinated by a central AI director named Ava. Its capabilities include automated loan underwriting, credit memo generation, document fraud detection, CECL reserve modeling, portfolio monitoring, and audit-ready reporting, with real-time processing under half a second.
Plans are Starter, Professional, and Enterprise, and you can review them on the RiskInMind pricing page. For a lending-focused starting point, look at the Loan Application product, or begin from the RiskInMind home page to request a demo and walk through your own baseline with our team.
FAQ
How do you calculate ROI for risk automation?
Subtract total costs from total benefits over a set horizon, then divide by total costs. Costs include licenses, implementation, data preparation, training, administration, and internal time. Benefits count only when tied to a financial or operating measure, with realization and attribution haircuts applied.
Is 37% ROI good for an automation project?
It depends on the horizon, your hurdle rate, and how certain the benefits are. A 37% return over three years is about 12% a year on a simple basis, while 37% in one year is strong. Compare it with your cost of capital and note how much comes from hard cost removal versus estimated loss avoidance.
How long does it take for risk automation to pay back?
It varies by scope, integration complexity, and adoption speed, so model it instead of assuming a figure. A three to five-year cash-flow model with payback month and NPV is a sound basis. ISACA's 2011 illustration showed a 30-month break-even for automated controls, which is an example, not a forecast.
What are the main risks to automation ROI?
Poor user adoption, unchanged legacy workflows, vendor customization costs, learning-curve costs, and ongoing administration. Integration and data cleanup can also run well above plan in fragmented environments. Assign owners, fix scope in writing, and track usage in the first 90 days.
Should compliance savings include avoided fines?
Not as a certain saving. Use measurable outcomes instead, such as audit testing hours, evidence retrieval time, and exceptions caught before an exam. These can be priced and verified, and they stand up better in front of a finance committee.
Sources
- The Economics of AI Adoption: Quantifying ROI in Financial Services, Matchpoint Partners
- A Framework for Estimating ROI of Automated Internal Controls, ISACA Journal
- A Definitive ROI Guide to Evaluating Risk & QC Tech Stacks, Mortgage Bankers Association
- Risk transformation, KPMG