
A risk management platform delivers measurable return on investment through labor savings, compliance efficiency, and reduced regulatory exposure. Risk platform ROI examples from 2026 show that financial institutions are not waiting years to see returns. Payback periods under seven months are now documented across enterprise GRC deployments, insurance data platforms, and compliance automation programs. For risk professionals building the business case for new technology, these case studies provide the clearest evidence available.
1. Real-world risk platform ROI examples from financial institutions
The strongest evidence for technology investment comes from quantified outcomes, not projected estimates. Three case studies from 2026 illustrate what financial institutions and large enterprises actually achieved.
Maintain 100% NCUA & OCC Audit Readiness
Monitor regulatory updates 24/7, check internal credit policies, and generate compliance trails with Erina (AI Regulatory Agent).
Enterprise GRC automation: 133% ROI in three years. A Forrester Total Economic Impact study found that enterprise GRC platforms deliver 133% ROI over three years with payback under six months. The $8.4M in total benefits broke down into $4.2M in labor savings, $2.3M in technology consolidation, and a 20% reduction in risk exposure. That breakdown matters because it shows ROI is not driven by a single factor. It comes from compounding gains across operations, IT spend, and risk posture simultaneously.

Swiss Re: 170% ROI with data estate consolidation. Swiss Re achieved 170% ROI with a 7.3-month payback by consolidating its data estate and cutting reporting time by 70–80%. Underwriters saved 30% of their daily working time. Data engineers improved productivity by 50%. The lesson for credit unions and community banks is direct: fragmented data environments are expensive, and unifying them pays back faster than most technology projects.
Fortune 100 financial firm: 80% compliance workload reduction. A Fortune 100 financial services firm reduced compliance workload by 80% and compressed audit preparation from six weeks to four days. The firm reallocated 2.4 full-time equivalents from compliance tasks to enterprise risk management activities. That reallocation represents both a cost saving and a capability upgrade. Staff previously absorbed by manual evidence gathering shifted to higher-value risk analysis work.
Supply chain risk platforms: 287% ROI over three years. Verdantix research found that modern risk platforms yield 287% ROI over three years, breaking even in six months. The financial benefits came primarily from avoided operational disruptions and compliance failures. The cost of a single major disruption routinely exceeds the full cost of a risk platform deployment, which explains why the returns appear so large.
2. Key drivers behind strong ROI in risk management platforms
Understanding why these returns occur is as important as knowing they exist. The same mechanisms appear across every high-performing case study.
Automation of manual reporting. Manual risk reporting consumes significant analyst and compliance officer time. Platforms that automate data collection, aggregation, and report generation convert that labor cost directly into savings. The Forrester study attributed $4.2M of its $8.4M benefit pool to labor savings alone.
Tool sprawl elimination. Decommissioning redundant legacy tools is a primary driver of rapid payback, often under seven months. Financial institutions frequently maintain separate systems for credit risk, market risk, compliance tracking, and audit management. Replacing that fragmented stack with a unified platform removes licensing costs, integration overhead, and the administrative burden of maintaining multiple vendor relationships.
Unified control libraries. Audit preparation is a large hidden cost center. Unified control libraries and automated evidence vaults can reduce audit prep time by over 90%. When controls are mapped once and reused across multiple regulatory frameworks, the efficiency gain compounds with every audit cycle.
AI-driven productivity gains. The highest tier of financial returns comes from evolving risk management to AI-first connected systems beyond manual workflows. AI agents that handle credit risk assessment, regulatory monitoring, and portfolio analysis free underwriters and risk officers to focus on judgment-intensive decisions. Swiss Re's 50% productivity gain among data engineers is a direct result of this shift.
Pro Tip: Map your current tool inventory before selecting a platform. Institutions that identify five or more redundant systems before deployment consistently achieve faster payback because consolidation savings are built into the business case from day one.
3. How to calculate ROI for a risk management platform investment
ROI calculation for risk platforms follows the standard formula: net benefits minus total costs, divided by total costs, expressed as a percentage. Applying it accurately requires identifying every relevant cost and benefit category.
Cost inputs include software licensing, implementation services, staff training, and ongoing maintenance. Many institutions undercount integration costs when connecting a new platform to core banking systems, loan origination software, or regulatory reporting feeds. Include those explicitly.
Benefit categories fall into four groups. First, direct labor savings from automation and workflow consolidation. Second, technology cost reduction from decommissioning legacy tools. Third, compliance efficiency gains measured in staff hours recovered from audit preparation and regulatory reporting. Fourth, risk reduction value, which converts avoided losses into dollar terms. ROI calculation should include labor savings, technology cost reduction, risk mitigation benefits, and payback timing to produce an accurate picture.
Converting risk reduction to dollars requires estimating the probability and cost of adverse events the platform prevents or mitigates. A 20% reduction in credit loss exposure on a $500M portfolio translates to a specific dollar figure. Use historical loss rates and regulatory fine data from your institution's own records to ground these estimates.
Payback period and net present value (NPV) both belong in the analysis. Payback period answers the question of how quickly the investment recovers its cost. NPV accounts for the time value of money and is more relevant for multi-year platform contracts. Present both metrics to your CFO and board.
Common pitfalls include ignoring change management costs, overstating risk reduction benefits without historical data to support them, and failing to account for the productivity dip during implementation. Build a conservative scenario alongside your base case. Decision-makers trust analyses that acknowledge uncertainty.
4. Best practices for maximizing ROI when implementing risk management platforms
Achieving the returns documented in case studies requires deliberate execution. The technology alone does not create the outcome.
Establish governance before go-live. Risk platform deployments succeed only with strong governance: defined risk appetite, escalation triggers, and structured assessment cycles. Without these, platforms become historical record systems rather than proactive tools. Automated alerts only generate value when they trigger documented decision processes.
Integrate with operational risk strategy, not just IT. Risk platform implementation fails without strategy alignment. Treating a platform deployment as an IT infrastructure project rather than an operational risk initiative is the most common reason institutions fail to achieve projected returns. Risk officers, compliance leads, and business unit heads must own the implementation alongside technology teams.
Phase out legacy tools on a defined schedule. Institutions that run new platforms in parallel with legacy systems for extended periods pay double the cost and capture none of the consolidation savings. Set a firm decommission date for each replaced tool and hold to it.
Invest in a unified data estate. Swiss Re's 170% ROI was built on data consolidation, not just software deployment. When risk data from credit, market, liquidity, and operational sources flows into a single environment, cross-team analytics improve and reporting time drops. The AI-driven risk management benefits documented across financial institutions depend on clean, unified data as their foundation.
Monitor and adjust continuously. ROI is not a one-time calculation. Quarterly reviews of platform utilization, alert response rates, and compliance cycle times identify where value is accumulating and where it is not. Institutions that treat ROI measurement as an ongoing practice sustain returns better than those that measure only at project close.
Pro Tip: Assign a named risk platform owner at the senior level, not just a project manager. Institutions with a CRO or VP-level champion consistently report higher adoption rates and faster realization of compliance efficiency gains.
Key takeaways
Risk platform ROI is highest when automation, data consolidation, and governance alignment work together rather than in isolation.
| Point | Details |
|---|---|
| Payback under seven months is achievable | Enterprise GRC and data platform deployments document payback periods of 6–7.3 months. |
| Labor savings drive the largest benefit share | The $4.2M labor savings component in the Forrester study exceeded technology consolidation savings by nearly 2x. |
| Audit prep is a hidden cost center | Unified control libraries reduce audit preparation from weeks to days, freeing significant staff capacity. |
| Governance unlocks platform value | Without defined risk appetite and escalation frameworks, platforms record history rather than prevent losses. |
| ROI calculation needs four benefit categories | Include labor savings, technology consolidation, compliance efficiency, and risk reduction value for an accurate analysis. |
My view on what these ROI numbers actually mean
The case studies cited here are real, and the numbers are large. But I want to offer a perspective that most ROI articles skip.
The fastest returns in every example came from operational consolidation, not from risk avoidance. Swiss Re's 170% ROI was built on eliminating data fragmentation. The Fortune 100 firm's gains came from replacing manual evidence gathering with automated workflows. The risk avoidance component, while real, was secondary to the operational efficiency story. That distinction matters when you are building a business case. Frame the investment around operational cost reduction first, and risk reduction second. Finance committees respond to cost savings with more confidence than they respond to probabilistic loss avoidance estimates.
The second point I would make is about governance. Platform ROI is only realized when governance structures like risk appetite and escalation frameworks ensure that automated alerts trigger action. I have seen institutions deploy capable platforms and then fail to achieve projected returns because no one defined what an alert should cause a decision-maker to do. The software is not the constraint. The decision process is.
Finally, qualitative benefits like improved cross-regional collaboration and enhanced regulator trust belong in your investment narrative even when they resist quantification. Regulators notice when institutions demonstrate proactive, data-driven risk management. That trust has real value in examination outcomes, even if it does not appear in a spreadsheet.
— Raj
How Riskinmind helps you benchmark and analyze risk platform returns
Risk professionals at credit unions, community banks, and lending institutions need more than case studies. They need tools that translate industry benchmarks into institution-specific investment analysis.
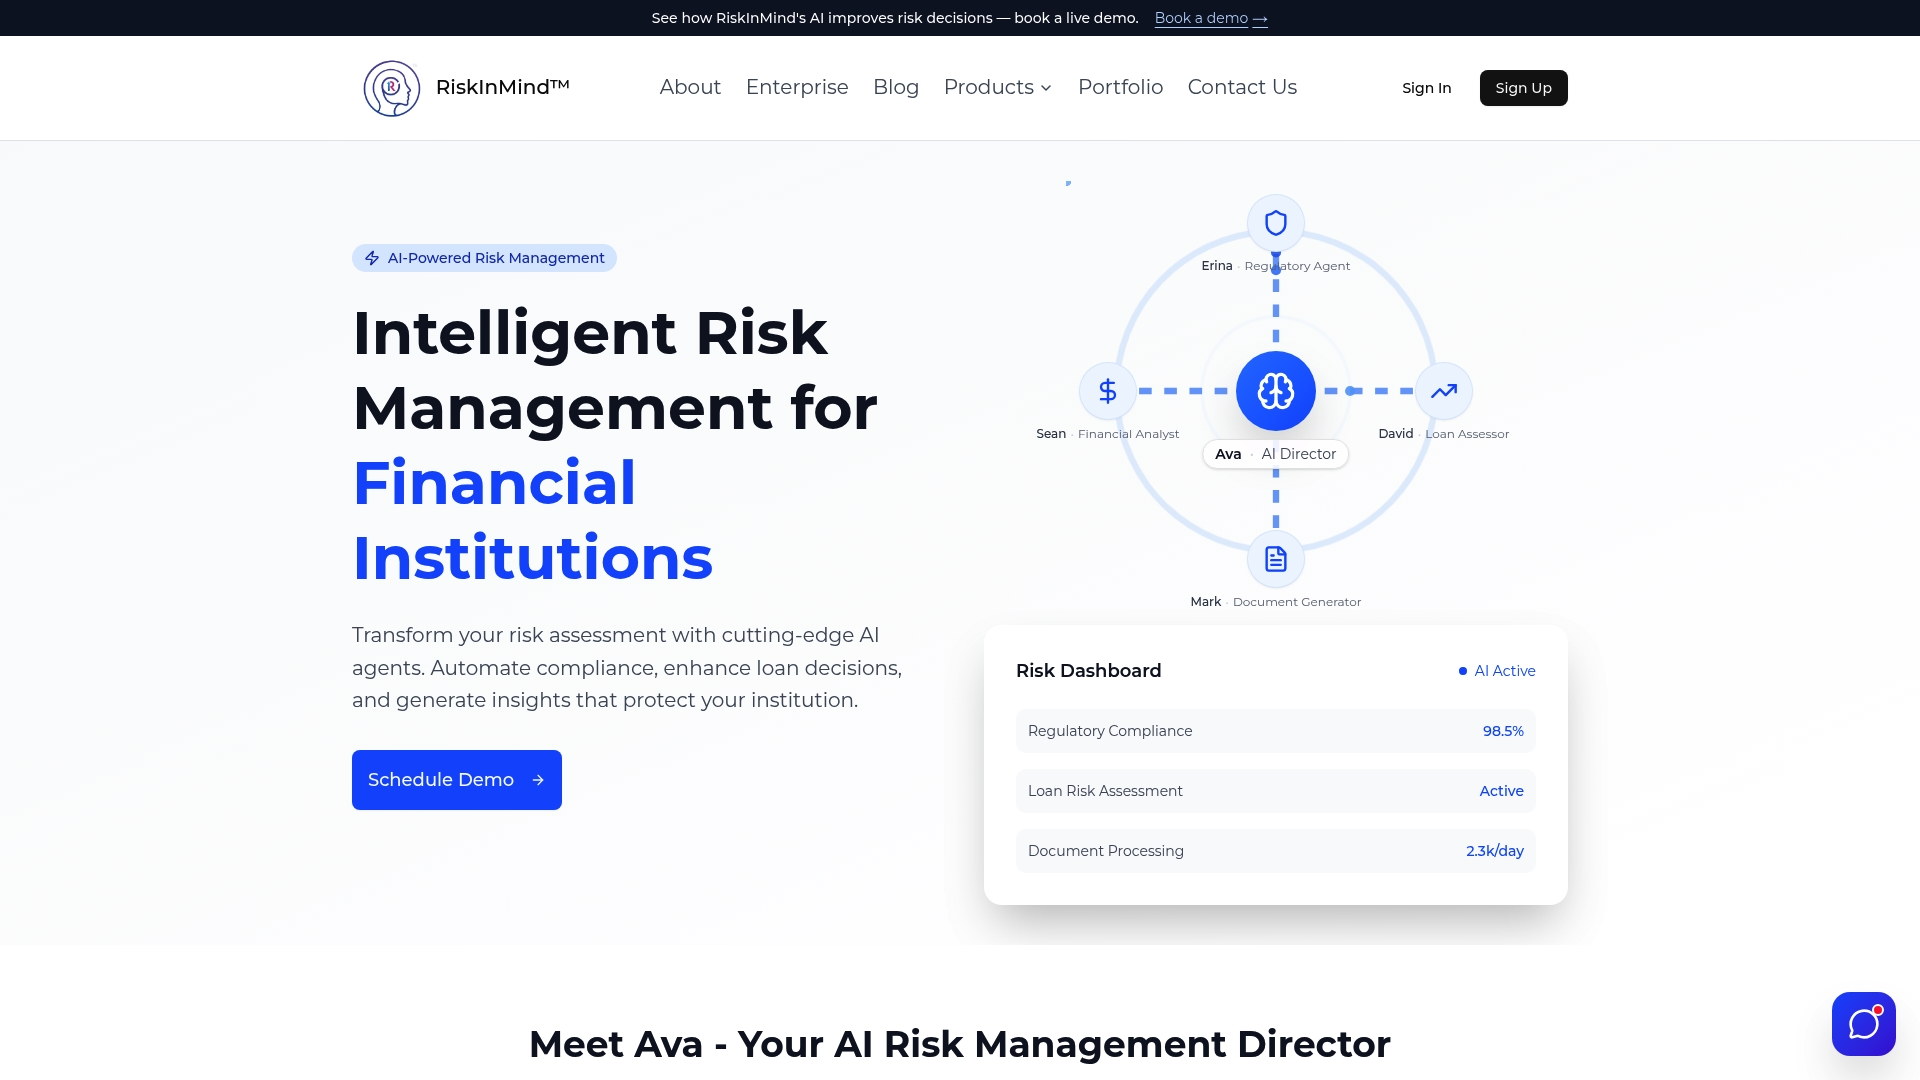
Riskinmind's peer benchmarking tools let you compare your institution's risk platform performance directly against peers of similar size, asset class, and regulatory profile. That comparison turns abstract ROI percentages into concrete gaps and opportunities specific to your portfolio. For portfolio managers and lending directors, Riskinmind's AI-driven risk analysis solutions provide real-time credit risk assessment, regulatory compliance monitoring, and portfolio analytics built on the same AI-first architecture that drives the returns documented in enterprise case studies. Request a demo to see how the platform performs against your current baseline.
FAQ
What is a realistic ROI for a risk management platform?
Enterprise GRC platforms have documented 133% ROI over three years with payback under six months. Supply chain risk platforms show returns as high as 287% over three years, depending on the cost of disruptions avoided.
How long does it take to see returns from a risk platform investment?
Payback periods of 6–7.3 months are documented in recent case studies. The fastest returns come from tool consolidation and labor savings, which begin accruing immediately after legacy systems are decommissioned.
What should I include when calculating risk platform ROI?
Include direct labor savings, technology consolidation savings, compliance efficiency gains, and risk reduction value. Also factor in payback period and NPV for multi-year contracts.
Why do some risk platform deployments fail to deliver projected ROI?
Deployments fail when governance structures are absent. Without defined risk appetite, escalation triggers, and senior ownership, platforms record data without driving decisions, and projected returns do not materialize.
How does AI improve ROI in risk management platforms?
AI automates credit risk assessment, regulatory monitoring, and reporting workflows, freeing underwriters and compliance officers for higher-value work. Swiss Re's data engineers improved productivity by 50% after consolidating onto an AI-enabled data platform.