
Liquidity ratios are primary short-term credit signals that directly determine loan approval, covenant thresholds, pricing spreads, and monitoring cadence. The CFA Institute is explicit: ratios alone reflect past-period balances, so every credit decision must pair them with cash-flow projections and stress tests to produce a forward-looking view.
- Underwriting gate: A ratio below sector-adjusted minimums typically triggers additional collateral requirements or outright decline before the credit committee sees the file.
- Covenant triggers: Thresholds set at origination become monitoring checkpoints; breaches accelerate remediation timelines or default notices.
- Pricing lever: Weak liquidity profiles generally translate to tighter spreads, shorter maturities, or higher collateral requirements.
Pro Tip: Never evaluate a liquidity ratio in isolation. Undrawn committed credit lines function as off-balance-sheet buffers that a ratio cannot capture. Always layer external funding sources into your assessment before reaching a credit verdict.
Maintain 100% NCUA & OCC Audit Readiness
Monitor regulatory updates 24/7, check internal credit policies, and generate compliance trails with Erina (AI Regulatory Agent).
Key Takeaways
Liquidity ratios are forward-looking credit tools only when paired with cash-flow projections, stress tests, and trend analysis across multiple periods.
| Point | Details |
|---|---|
| Compute all three ratios | Current, quick, and cash ratios each reveal a different layer of short-term risk; use all three together. |
| Stress-test before deciding | Apply a receivable-delay or inventory-write-down scenario to find the ratio floor before setting covenant thresholds. |
| Adjust for asset quality | Remove aged receivables and slow inventory before using ratios in covenant testing or credit committee presentations. |
| Set monitoring frequency by risk tier | High-risk borrowers warrant weekly review; medium-risk monthly; low-risk quarterly. |
| Riskinmind automates the workflow | Riskinmind's platform automates ratio calculation, trend detection, and stress overlays with SOC 2® audit trails. |
Table of Contents
- How liquidity ratios define the credit assessment framework
- How lenders translate ratios into underwriting and covenant decisions
- Why ratios mislead without trend analysis and asset-quality adjustments
- Operationalizing ratio analysis inside your credit workflow
- How an AI-enabled platform supports liquidity monitoring in practice
- Worked example: calculating ratios and running a stress scenario
- Limitations, red flags, and immediate actions for credit teams
- A credit analyst's perspective on what actually matters
- Riskinmind brings automated liquidity monitoring to your credit portfolio
- Sources
How liquidity ratios define the credit assessment framework
The three principal liquidity ratios measure a borrower's capacity to cover short-term obligations, each with progressively narrower asset inclusion.
| Ratio | Formula | What It Captures | Benchmark Guidance |
|---|---|---|---|
| Current ratio | Current assets ÷ current liabilities | Broadest short-term coverage, including inventory | Above 1.0 is a general baseline; industry targets like 2:1 are common in some sectors |
| Quick ratio (acid-test) | (Cash + short-term investments + receivables) ÷ current liabilities | Excludes inventory; conservative worst-case view | Above 1.0; tighter industries often require higher |
| Cash ratio | (Cash + short-term investments) ÷ current liabilities | Strictest measure; only immediately liquid assets | Varies widely; used for stress scenarios |
Choose the current ratio for broad coverage when inventory is genuinely liquid. The quick ratio is the right tool when inventory liquidation is uncertain or slow, which is common in manufacturing and retail. The cash ratio belongs in stress scenarios and covenant floors where you need to know the absolute minimum cushion.
Benchmarks require industry calibration. A construction firm carrying significant work-in-progress inventory will show a different current ratio than a software company with minimal current assets, yet both may be equally creditworthy. Seasonality compounds this: a retailer's ratio in November looks nothing like its ratio in February.
How lenders translate ratios into underwriting and covenant decisions
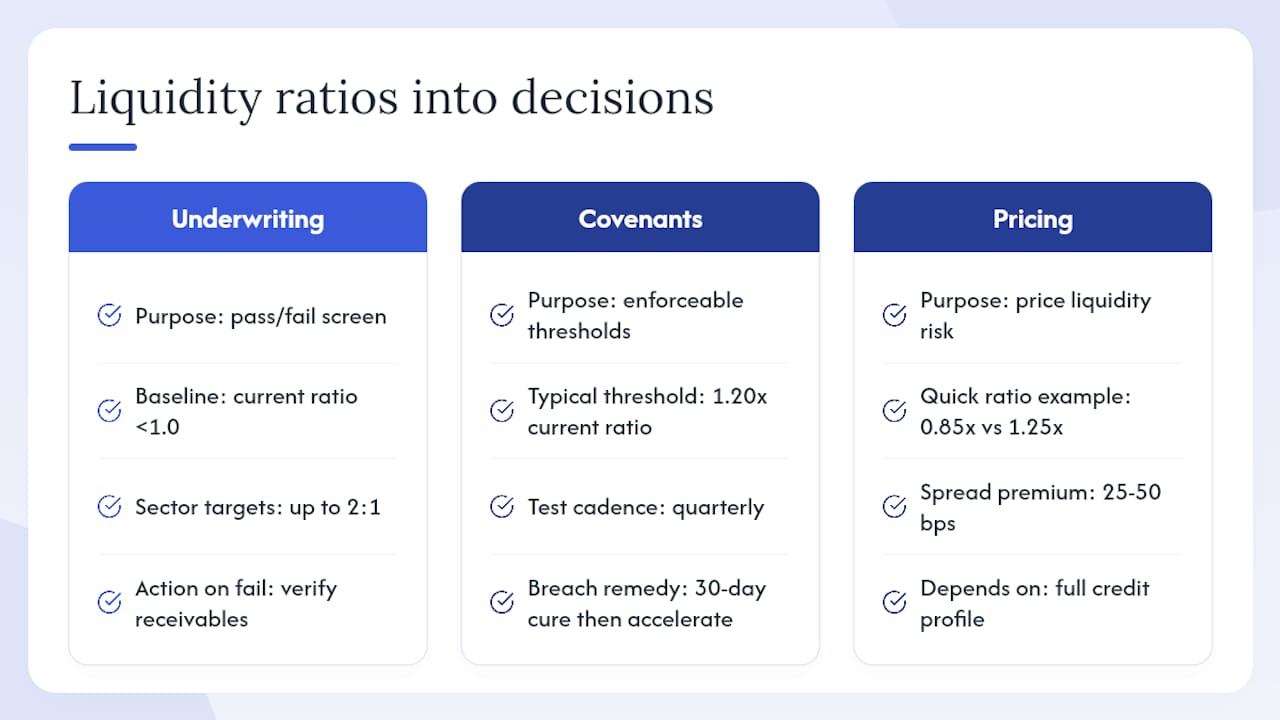
At the underwriting stage, credit teams use liquidity ratios as pass/fail screens before deeper analysis begins. A current ratio below 1.0 signals that current liabilities exceed current assets, which typically requires the analyst to verify receivable quality through ageing schedules and confirm inventory liquidation assumptions before the file advances. However, sector-specific minimums for approval and covenant calibration may differ: while above 1.0 is a broad baseline, some sectors set targets as high as 2:1, so always calibrate thresholds for industry norms and seasonality.
The NCUA's examiner guidance formalizes this practice: examiners monitor liquidity ratios alongside trend data to identify institutions that may struggle to meet obligations without emergency external funding. Credit teams at community banks and credit unions apply the same logic to borrower files.
Covenant design translates ratios into enforceable thresholds. A typical structure might read: "Borrower shall maintain a minimum current ratio of 1.20x, tested quarterly; a breach triggers a 30-day cure period, after which the lender may accelerate the facility." Step-down provisions and covenant thresholds should be calibrated to industry-specific targets: while 1.0 is a baseline, some sectors require higher ratios, such as 2:1. Pricing responds similarly: a borrower whose quick ratio sits at 0.85x will typically face a spread premium of 25–50 basis points relative to a peer at 1.25x, though exact pricing depends on the full credit profile.
Rating agencies treat liquidity as a standalone constraint. A borrower with sound long-term fundamentals can still receive a constrained short-term rating if liquidity metrics are weak, which means a lender relying solely on leverage or profitability ratios will systematically misprice short-term credit risk.
Pro Tip: When reviewing covenant packages, test the threshold against the borrower's historical seasonal trough, not the annual average. A covenant set at 1.20x that the borrower routinely breaches in Q3 due to seasonal inventory build is a compliance event waiting to happen.
Why ratios mislead without trend analysis and asset-quality adjustments
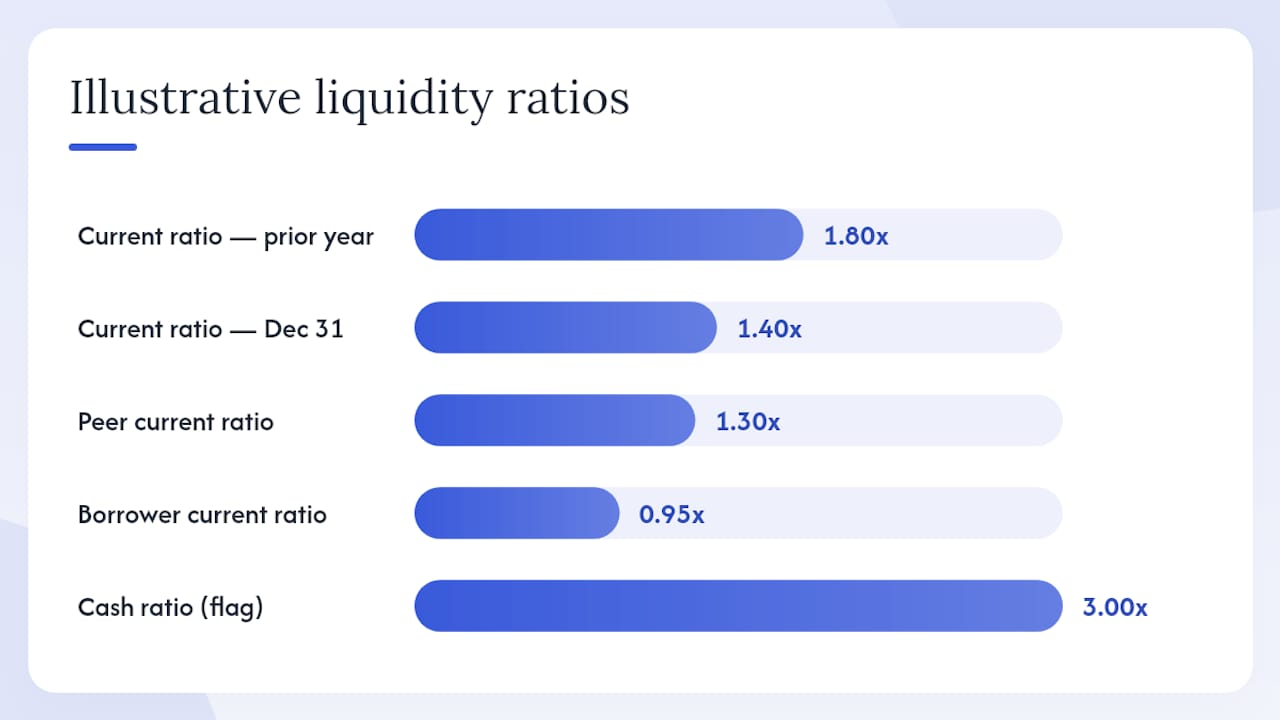
Ratios are snapshots. A current ratio of 1.40x on December 31 says nothing about whether that figure was 1.80x twelve months earlier or whether receivables aged beyond 90 days account for a third of current assets.
AccountingTools identifies the core pitfall: current liabilities' payment dates may not align with when current assets can actually be converted to cash, so even a healthy ratio can mask an imminent shortfall. Common distortions include:
- Aged receivables that are unlikely to collect within the ratio's implied timeframe
- Inventory that requires significant discounting to liquidate quickly
- Payables concentrated in the next 30 days while receivables are 60–90 days out
- Undrawn committed facilities that provide real liquidity but appear nowhere in the ratio
CARE Ratings addresses this directly: a complete liquidity assessment combines internal cash accruals, available cash balances, and external sources such as undrawn lines to determine short-term funding adequacy. A borrower with a current ratio of 0.95x but a fully committed, undrawn $5 million revolver may be more liquid in practice than a peer showing 1.30x with no external facility.
Pro Tip: Very high liquidity ratios can signal idle capital rather than financial strength. A cash ratio above 3.0x in a capital-intensive business often means management is hoarding cash instead of deploying it productively. Flag it as an efficiency question, not just a credit positive.
Operationalizing ratio analysis inside your credit workflow
Ratios paired with cash-flow projections produce an actionable forward-looking signal. The workflow that makes this practical follows a clear sequence.
- Data ingestion: Pull balance-sheet and cash-flow data from the borrower's accounting system or financial statements, standardized to a consistent chart of accounts.
- Normalization: Adjust for one-time items, reclassify any long-term receivables misclassified as current, and remove non-liquid inventory categories.
- Ratio calculation: Compute current, quick, and cash ratios; record alongside the prior three periods for trend comparison.
- Trend and peer benchmarking: Compare against the borrower's own history and against industry-adjusted peer benchmarks.
- Stress overlay: Apply a defined scenario (e.g., 30% receivable collection delay, 20% inventory write-down) and recalculate ratios to identify the stress floor.
- Alert and escalation: Set threshold alerts that trigger analyst review when ratios breach covenant levels or fall below the stress floor.
OpenStax's Principles of Finance recommends pairing ratio analysis with operating cash flow and net working capital measures for a complete short-term picture. Automation should prioritize real-time data feeds, anomaly detection on ageing schedules, and drilldown into receivable concentration. Any automated system must maintain a full audit trail and carry SOC 2® certification to satisfy examiner requirements.
Pro Tip: Assign ownership explicitly. Ratio monitoring without a named analyst responsible for exception review degrades into a reporting exercise. Pair every automated alert with a defined escalation path and a response SLA.
How an AI-enabled platform supports liquidity monitoring in practice
AI platforms increase monitoring frequency and reduce manual false positives by automating data normalization and trend detection across a portfolio. For a credit team managing hundreds of borrower files, the operational difference is material.
Key capabilities to verify in any platform evaluation:
- Automated ingestion from borrower accounting systems, reducing manual data entry errors
- Real-time trend detection that flags ratio deterioration before covenant breach
- Integrated stress-test overlays that recalculate ratios under defined scenarios without analyst intervention
- Standardized covenant monitoring with configurable thresholds and escalation rules
- Audit-ready reporting that satisfies examiner requests without additional preparation
Security and compliance signals matter as much as analytical capability. Verify SOC 2® Type II certification, encryption at rest and in transit, role-based access controls, and a documented incident-response process before committing to any platform.
In a pilot evaluation, ask the vendor to demonstrate: which data sources the platform ingests natively, how long it takes to generate a ratio alert after a balance-sheet update, and what report formats are available for credit committee and examiner review.
Pro Tip: Request a live demo using your own anonymized borrower data, not the vendor's curated sample set. The gap between demo performance and production performance is where most platform disappointments originate.
Worked example: calculating ratios and running a stress scenario
Base balance sheet (illustrative borrower):
- Cash: $800,000
- Accounts receivable: $1,200,000
- Inventory: $600,000
- Total current assets: $2,600,000
- Total current liabilities: $1,800,000
Step 1: Calculate base ratios.
- Current ratio: $2,600,000 ÷ $1,800,000 = 1.44x
- Quick ratio: ($800,000 + $1,200,000) ÷ $1,800,000 = 1.11x
- Cash ratio: $800,000 ÷ $1,800,000 = 0.44x
Step 2: Apply stress scenario — 30% receivable collection delay.
Adjusted receivables available within the period: $1,200,000 × 70% = $840,000. Cash remains $800,000. Inventory unchanged.
| Ratio | Base | Stressed |
|---|---|---|
| Current ratio | 1.44x | 1.24x |
| Quick ratio | 1.11x | 0.91x |
| Cash ratio | 0.44x | 0.44x |
Step 3: Interpret and recommend.
The stressed quick ratio falls below 1.0x, meaning the borrower cannot cover current liabilities from liquid assets alone if 30% of receivables delay. Recommended lender responses:
- Tighten the current ratio covenant from 1.20x to 1.30x with quarterly testing.
- Require an updated 13-week cash-flow projection at each covenant test date.
- Restrict additional draws on any revolving facility until the quick ratio recovers above 1.10x.
- Increase monitoring frequency from quarterly to monthly for the next two periods.
Limitations, red flags, and immediate actions for credit teams
Ratios are necessary but not sufficient. They capture a moment in time, exclude off-balance-sheet facilities, and say nothing about the quality of the assets they include.
Red-flag checklist:
- Declining trend across three or more consecutive periods, even if the absolute ratio remains above threshold
- Sudden drop in the cash ratio without a corresponding explanation in the borrower's cash-flow statement
- Receivables concentrated in one or two counterparties, creating collection risk that the ratio cannot reflect
- Reliance on undrawn lines that carry material adverse change clauses or are subject to annual renewal
Immediate actions:
- Update covenant thresholds to reflect current industry benchmarks and the borrower's seasonal trough
- Require updated cash-flow projections covering at least 13 weeks for any borrower showing ratio deterioration
- Test whether the borrower's undrawn facilities are genuinely accessible (confirm no MAC clauses have been triggered)
- Adjust portfolio monitoring frequency by risk tier: weekly for high-risk borrowers, monthly for medium-risk, quarterly for low-risk
Pro Tip: Treat a sudden improvement in the current ratio with the same scrutiny as a decline. Borrowers sometimes delay payables at period-end to inflate the ratio for covenant testing. Cross-check against the cash-flow statement's changes in working capital.
A credit analyst's perspective on what actually matters
Liquidity ratios work best as early-warning triggers, not final verdicts. The discipline is: ratio signals an anomaly, cash-flow overlay confirms or refutes it, and then you act. Credit committees that skip the overlay step and react to a ratio breach alone generate unnecessary covenant waivers and miss genuine deterioration hidden behind a temporarily healthy ratio.
Governance matters more than most teams acknowledge. A ratio monitoring program without defined ownership, escalation paths, and a feedback loop into covenant design is a compliance exercise, not a risk management tool. Getting credit committee buy-in requires presenting trend charts alongside stress results, not just the current period's ratio. A single data point rarely moves a committee; a three-period trend with a stressed scenario attached almost always does.
The checklist for a committee briefing: current ratio trend (three periods minimum), quick ratio stress result under your defined scenario, and a specific covenant action recommendation. Keep it to one page. Committees that receive ratio data without a recommended action tend to defer, and deferral is where credit risk accumulates.
Riskinmind brings automated liquidity monitoring to your credit portfolio
Credit teams that manually track liquidity ratios across large portfolios face a straightforward problem: by the time deterioration is visible in a quarterly report, the remediation window has narrowed. Riskinmind's AI-powered platform addresses this by automating ratio calculation, trend detection, and stress overlays in real time, so your analysts spend time on decisions rather than data assembly.
The platform ingests balance-sheet and cash-flow data directly, normalizes it against configurable chart-of-accounts mappings, and generates covenant-breach alerts before the test date arrives. Integrated stress scenarios recalculate ratios under defined shocks without manual intervention, and every output carries a full audit trail for examiner review. SOC 2® Type II certification and bank-grade encryption mean your borrower data stays protected throughout. For credit teams ready to move from quarterly snapshots to continuous monitoring, explore the portfolio manager solution or request a pilot using your own loan data.
Sources
- NCUA Examiner Guide — Liquidity ratio analysis
- CFA Institute — Credit analysis for corporate issuers (refresher)
- HBS Online blog — Liquidity ratios (overview and guidance)
- Corporate Finance Institute — Credit analysis ratios (liquidity)
- ICRA — Rating approach – liquidity analysis (March 2026)
- CARE Ratings — Liquidity analysis of non‑financial sector entities (Sept 2024)
- AccountingTools — Liquidity ratios
- OpenStax — Principles of Finance (Liquidity ratios)
This article is general information, not a substitute for advice from a qualified financial advisor. Consult a qualified financial professional about your own circumstances before acting on anything here.