
Market risk analysis is defined as the systematic evaluation of potential financial losses arising from adverse movements in market prices, including interest rates, foreign exchange rates, equity prices, commodity prices, and credit spreads. Every portfolio held by a bank, credit union, or investment firm carries exposure to these forces, and quantifying that exposure is not optional. Regulators, boards, and counterparties all demand it. The core tools of this discipline, Value at Risk (VaR) and Expected Shortfall (ES), translate complex price dynamics into capital figures that decision-makers can act on. Understanding how to analyze market risk is the foundation of sound portfolio management and regulatory compliance in 2026.
What is market risk analysis and why does it matter?
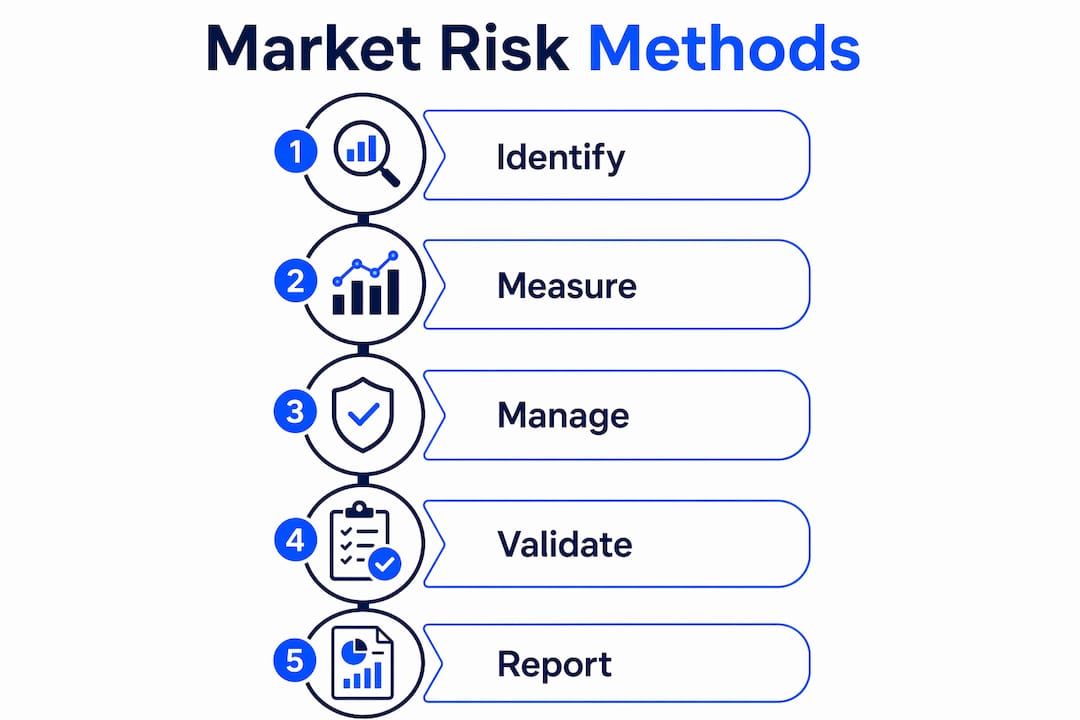
Market risk analysis is the process of identifying, measuring, and managing potential losses caused by fluctuations in market variables such as equity prices, interest rates, foreign exchange rates, and commodity prices. The discipline sits at the intersection of quantitative modeling, regulatory compliance, and strategic portfolio management. For financial professionals, it answers one fundamental question: how much can we lose, and under what conditions?
Maintain 100% NCUA & OCC Audit Readiness
Monitor regulatory updates 24/7, check internal credit policies, and generate compliance trails with Erina (AI Regulatory Agent).

The importance of market risk analysis extends well beyond internal risk dashboards. Supervisory bodies including the Federal Reserve, the European Central Bank, and the Basel Committee on Banking Supervision require institutions to demonstrate that their capital buffers reflect actual market exposures. Failure to do so carries direct consequences, from capital add-ons to supervisory downgrades. Market risk analysis is therefore both a technical discipline and a compliance obligation.
At the portfolio level, rigorous market risk assessment informs asset allocation, hedging decisions, and limit-setting. A credit union holding a large fixed-rate mortgage book faces significant interest rate risk when rates rise sharply. A community bank with cross-border trade finance exposure carries foreign exchange risk on every open position. Identifying these exposures early, before they crystallize into losses, is precisely what market risk analysis is designed to do.
What are the main components and types of market risk?
Core risk classes in market risk analysis include interest rate risk, currency risk, equity risk, commodity risk, and credit spread risk. Each class behaves differently, responds to different market drivers, and requires distinct measurement approaches.
- Interest rate risk affects the value of bonds, loans, and interest rate derivatives when benchmark rates shift. A 200 basis point rate hike, for example, can materially reduce the mark-to-market value of a long-duration bond portfolio.
- Equity risk stems from stock price volatility and affects both direct equity holdings and equity-linked derivatives. Beta measures a portfolio's sensitivity to broad market movements.
- Foreign exchange (FX) risk arises from currency fluctuations affecting cross-border assets, liabilities, and revenue streams. Institutions with significant dollar-denominated funding but local-currency assets carry structural FX mismatches.
- Commodity price risk impacts physical inventories, commodity derivatives, and energy-linked loan books. Agricultural lenders and energy banks are particularly exposed.
- Credit spread risk reflects changes in the yield premium demanded by investors for holding corporate or sovereign debt over risk-free benchmarks. Spread widening reduces bond values even when the underlying credit has not defaulted.
Beyond these categories, analysts distinguish between systematic risk, which is market-wide and cannot be diversified away, and unsystematic risk, which is specific to a single issuer or sector and can be reduced through diversification. Systematic risk is the primary focus of market risk analysis because it cannot be eliminated through portfolio construction alone.
Pro Tip: When mapping your institution's risk exposures, build a risk inventory that separates systematic from unsystematic components. This prevents double-counting when aggregating capital requirements across desks.
Which methods and models are used to measure market risk?
The measurement of market risk relies on a hierarchy of quantitative tools, each suited to different portfolio types, time horizons, and regulatory contexts. VaR estimates the maximum potential loss over a specific timeframe at a given confidence level, while Expected Shortfall calculates the average loss in scenarios that exceed the VaR threshold.
VaR is calculated using three primary methods. Historical simulation replays actual past returns against the current portfolio, requiring no distributional assumptions. The variance-covariance method assumes normally distributed returns and uses statistical parameters to estimate loss boundaries quickly. Monte Carlo simulation generates thousands of hypothetical price paths using specified statistical processes, making it the most flexible but computationally intensive approach.
| Method | Strengths | Limitations |
|---|---|---|
| Historical simulation | No distributional assumptions; captures past fat tails | Dependent on historical window; slow to adapt to regime changes |
| Variance-covariance | Fast; analytically tractable | Assumes normal distribution; underestimates tail risk |
| Monte Carlo simulation | Flexible; handles complex derivatives | Computationally intensive; model-dependent |
| Expected Shortfall (ES) | Captures tail severity beyond VaR threshold | Harder to backtest; more data-intensive |
Expected Shortfall better captures tail risk severity than VaR, which only specifies a loss threshold without information on outcomes beyond that point. This distinction matters enormously during stress events. In the 2008 financial crisis and the March 2020 COVID shock, actual losses in many portfolios exceeded VaR estimates by multiples, precisely because VaR said nothing about the magnitude of losses in the tail.
Sensitivity measures complement these statistical tools. Duration quantifies a bond portfolio's price sensitivity to interest rate changes. Delta, gamma, and vega measure an options portfolio's sensitivity to the underlying price, the rate of change of that sensitivity, and implied volatility respectively. These granular metrics allow risk managers to decompose aggregate risk into its constituent drivers.
Backtesting acts as a primary defense against over-reliance on flawed model assumptions. By comparing predicted VaR figures against actual daily profit and loss outcomes, analysts can identify systematic model failures before they produce capital shortfalls. Regulators require formal backtesting programs, and institutions with excessive VaR exceptions face capital multiplier penalties.
Pro Tip: Never rely solely on parametric VaR for derivative-heavy portfolios. Fat-tailed events in options books routinely exceed normal distribution assumptions. Supplement with historical simulation and stress scenarios calibrated to actual crisis episodes.
How do regulatory frameworks shape market risk analysis under FRTB?
The Fundamental Review of the Trading Book (FRTB) represents the most significant overhaul of market risk capital rules since Basel II. Finalized under the Basel III/IV framework, FRTB replaces VaR with Expected Shortfall for regulatory capital calculations and introduces a Standardized Approach based on sensitivity measures for enhanced risk capture and consistency.
Under FRTB's Standardized Approach (SA), capital requirements are calculated using a sensitivity-based method (SBM) that applies delta, vega, and curvature sensitivities across core risk classes. This granular approach replaces the broad asset-class bucketing used under older frameworks, which allowed institutions to obscure concentrated exposures within diversified categories. The shift to sensitivities-based measures enhances risk sensitivity and regulatory consistency while minimizing model risk manipulation.
| FRTB element | Description |
|---|---|
| Risk measure | Expected Shortfall replaces VaR for capital calculations |
| Standardized Approach | Sensitivity-based method using delta, vega, and curvature |
| Liquidity horizons | Capital scaled by asset-class liquidity, from 10 to 120 days |
| Stress testing mandate | Institutions must simulate extreme shocks, including 30% equity drops |
| Internal model approval | Desk-level approval required; failed desks revert to SA |
Liquidity horizons are a particularly consequential FRTB innovation. Rather than applying a uniform 10-day holding period, FRTB assigns liquidity horizons ranging from 10 days for major currency pairs to 120 days for less liquid credit instruments. This means capital charges for illiquid positions are substantially higher, directly incentivizing institutions to manage liquidity risk alongside market risk. For community banks and credit unions reviewing their regulatory compliance obligations, understanding FRTB's liquidity horizon framework is increasingly relevant as supervisory expectations migrate from large banks toward smaller institutions.
Stress testing mandates under FRTB require institutions to simulate extreme market shocks, including scenarios such as a 30% equity market decline or a 200 basis point rate hike, and to hold capital sufficient to absorb those losses. These stress tests simulate extreme shocks and are not theoretical exercises. They directly determine minimum capital requirements and must be integrated into the institution's ongoing risk management workflow.
What practical strategies can professionals use to manage market risk?
Effective market risk management strategies combine hedging, diversification, real-time monitoring, and disciplined limit frameworks. No single technique is sufficient on its own, and the most resilient institutions treat these tools as a system rather than a checklist.
Hedging with derivatives remains the most direct method of reducing specific market exposures. Interest rate swaps convert floating-rate liabilities to fixed, protecting net interest margin when rates rise. Currency forwards lock in exchange rates for cross-border transactions, eliminating FX uncertainty. Options strategies provide asymmetric protection, capping downside while preserving upside participation. The cost of hedging must always be weighed against the risk reduction achieved, particularly in low-margin community banking environments.
Dynamic portfolio rebalancing based on current risk assessments prevents portfolio drift from creating unintended concentrations. A portfolio that was well-diversified six months ago may have become equity-heavy after a sustained equity rally, increasing systematic risk exposure without any active decision to do so. Market risk assessment is not a one-time report but an ongoing process essential for active portfolio management. Institutions that treat it as an annual exercise rather than a continuous discipline consistently underestimate their actual risk exposure.
Real-time risk monitoring has become a practical reality for institutions with the right technology infrastructure. Millisecond-level scanning of order book dynamics reduces exposure to rapid market changes that daily VaR calculations would miss entirely. Advanced risk desks now use intraday ES calculations and real-time sensitivity dashboards to detect position drift before it breaches established limits.
- Set explicit risk limits for each major risk class, with escalation protocols triggered at 80% of limit utilization.
- Integrate stress test results into capital planning cycles, not just regulatory submissions.
- Reassess risk exposures after significant market events, including rate decisions, geopolitical shocks, and earnings seasons.
- Use step-by-step risk assessment frameworks to standardize how analysts evaluate new positions before they enter the book.
Pro Tip: Combine granular sensitivity measures with scenario analysis to get a richer picture of potential losses. Stress testing and scenario analysis together provide what neither tool delivers alone: both the probability distribution of losses and the magnitude of outcomes in extreme conditions.
Key takeaways
Effective market risk analysis requires combining quantitative metrics like VaR and Expected Shortfall with qualitative controls, regulatory compliance, and continuous portfolio monitoring.
| Point | Details |
|---|---|
| Core risk classes | Interest rate, equity, FX, commodity, and credit spread risks each require distinct measurement approaches. |
| VaR vs. Expected Shortfall | ES captures the severity of tail losses that VaR's threshold measure cannot quantify. |
| FRTB compliance | FRTB replaces VaR with ES for capital and introduces sensitivity-based methods with liquidity-adjusted horizons. |
| Model validation | Backtesting VaR against actual P&L is a regulatory requirement and a critical defense against model failure. |
| Ongoing monitoring | Market risk assessment is a continuous process, not a periodic report, requiring real-time data and dynamic rebalancing. |
The metric is only as good as the model behind it
After working through hundreds of risk model reviews, the pattern that concerns me most is not the institution that uses VaR incorrectly. It is the institution that uses VaR correctly and stops there. The number comes out, it looks reasonable, and the conversation ends. That is where real risk accumulates.
The transition from VaR to Expected Shortfall under FRTB is not just a regulatory technicality. It reflects a hard-won lesson from multiple crisis episodes: knowing where the loss boundary sits tells you almost nothing about what happens when you cross it. ES forces analysts to think about the distribution of outcomes in the tail, not just the threshold. That shift in thinking matters more than the formula itself.
What I have also observed is that quantitative metrics combined with qualitative assessments of internal controls and reporting quality consistently outperform pure model-based approaches in supervisory evaluations. Weak controls degrade supervisory ratings even when the numbers look clean. The ECB's SREP methodology makes this explicit, and it should inform how every risk team structures its reporting.
The future of market risk analysis belongs to institutions that treat it as a living discipline. Models need validation cycles. Stress scenarios need updating after each major market event. And the people running these models need the intellectual honesty to challenge their own outputs. Technology accelerates all of this, but it does not replace the judgment that sits behind it.
— Raj
How Riskinmind supports your market risk workflow
Riskinmind's AI-powered platform gives financial institutions the infrastructure to move from periodic risk snapshots to continuous, real-time market risk assessment. The platform's specialized AI agents handle loan application risk assessment and commercial real estate analysis through the CRE loan risk predictor, translating complex exposure data into decision-ready outputs in under half a second. Portfolio monitoring alerts and peer benchmarking tools allow credit unions, community banks, and lenders to track risk drift against industry comparators without building custom analytics infrastructure. For teams looking to sharpen their risk reporting practices, Riskinmind's risk reporting optimization guide provides a practical starting point.
FAQ
What is market risk analysis in simple terms?
Market risk analysis is the process of measuring how much a portfolio can lose due to changes in market prices, including interest rates, equity values, exchange rates, and commodity prices. It uses tools like Value at Risk and Expected Shortfall to translate price volatility into concrete loss estimates.
What are the main components of market risk?
The five core components are interest rate risk, equity risk, foreign exchange risk, commodity price risk, and credit spread risk. Each component requires separate measurement and management because they respond to different market drivers and affect different parts of a portfolio.
How does FRTB change market risk measurement?
FRTB replaces VaR with Expected Shortfall for regulatory capital calculations and introduces a sensitivity-based Standardized Approach using delta, vega, and curvature measures. It also applies liquidity horizons ranging from 10 to 120 days depending on asset class, making capital requirements more sensitive to actual market liquidity.
Why is backtesting important in market risk analysis?
Backtesting compares a model's predicted VaR figures against actual daily profit and loss outcomes to identify systematic failures in model assumptions. Regulators require formal backtesting programs, and institutions with too many VaR exceptions face capital multiplier penalties under Basel rules.
How often should market risk assessments be updated?
Market risk assessment is a continuous process, not an annual report. Portfolios should be re-evaluated after significant market events, regulatory changes, and periods of elevated volatility to capture risk changes from portfolio drift and shifting market conditions.
Recommended
- Risk Assessment Methodology: A 2026 Guide for Financial Leaders | RiskInMind
- Risk analytics step by step: A practical guide for financial institutions | RiskInMind
- Streamline your risk analysis process for better compliance | RiskInMind
- Step by Step Risk Assessment for Financial Institutions | RiskInMind