
Inadequate risk assessment doesn't just expose financial institutions to potential losses. It creates regulatory liability, erodes stakeholder confidence, and compounds systemic vulnerabilities across loan portfolios, operational controls, and compliance programs. A rigorous step by step risk assessment, known formally as a structured risk evaluation process in ISO 31000 and enterprise risk management frameworks, is the difference between proactive governance and reactive damage control. This guide delivers a complete, methodology-driven approach tailored specifically to risk professionals at credit unions, community banks, and lenders who need to move beyond checklists and apply genuinely repeatable processes.
Table of Contents
- Key Takeaways
- Starting the step by step risk assessment process
- Risk identification and analysis methods
- Risk evaluation and treatment decisions
- Documentation, reporting, and ongoing review
- What most risk assessments get wrong
- How Riskinmind transforms the risk assessment process
- FAQ
Maintain 100% NCUA & OCC Audit Readiness
Monitor regulatory updates 24/7, check internal credit policies, and generate compliance trails with Erina (AI Regulatory Agent).
Key Takeaways
| Point | Details |
|---|---|
| Scope definition comes first | Align assessment boundaries with business objectives before identifying any risks or gathering data. |
| Use qualitative scoring before quantitative | Probability-impact matrices should precede Monte Carlo simulations, applied selectively to highest-priority risks. |
| Risk registers need cause-event-consequence detail | Vague labels reduce operational value; structured entries improve repeatability and decision quality. |
| Treatment plans require ownership and pricing | Board-ready reports must assign RACI responsibilities and time-bound cost estimates to drive funding decisions. |
| Assessment is an iterative cycle, not a project | Triggers for reassessment and scheduled reviews are as critical as the initial evaluation itself. |
Starting the step by step risk assessment process
The temptation in most financial institutions is to begin risk identification immediately, treating scope definition as an administrative formality. That shortcut consistently produces assessments that are either too broad to be operationally useful or too narrow to satisfy regulatory scrutiny. The ISO 31000 risk management framework addresses this directly by positioning stakeholder communication and context-setting as formal prerequisites to identification, not background tasks.
Defining scope means specifying which business units, processes, systems, and regulatory obligations fall within the assessment boundary. For a community bank conducting a credit risk review, that might mean limiting scope to commercial real estate loans originated in the past 36 months while excluding legacy consumer portfolios. For an annual operational risk assessment, scope might include all third-party vendors with access to core banking systems.
Identifying stakeholders matters as much as defining scope. Loan officers, compliance officers, IT security personnel, and the CFO each carry different risk intelligence. Stakeholder engagement throughout the process improves both the quality of identified risks and the buy-in required to act on treatment recommendations.
Before launching into the assessment itself, assemble the foundational inputs. These typically include:
- Asset inventories and system maps
- Prior audit findings and regulatory examination reports
- Historical loss event data and near-miss logs
- Existing policy documents and control frameworks
- Regulatory requirements specific to your institution type (OCC, NCUA, FDIC)
Establish risk criteria and scoring scales at this stage, not later. Decide whether you will use a 3x3, 4x4, or 5x5 probability-impact matrix, and define what each tier means in concrete financial or operational terms. A "high likelihood" rating should correlate to a specific frequency threshold, such as more than once per quarter, not a subjective impression.
Pro Tip: Document your scope statement and risk criteria as a formal one-page brief shared with all assessment participants before any workshops begin. Misaligned assumptions are the most common cause of inconsistent risk scoring across departments.
Risk identification and analysis methods
With scope and criteria established, risk identification is where comprehensive risk evaluation moves from planning to execution. Financial institutions face a distinctive threat profile: credit risk from borrower default, operational risk from process failures or fraud, market risk from interest rate movements, liquidity risk from deposit concentration, and compliance risk from regulatory violations.
A structured identification approach uses cause-event-consequence framing. Rather than logging a risk as "fraud," a well-constructed risk record reads: "Inadequate dual-control procedures over wire transfer approvals (cause) may result in unauthorized fund transfers (event), leading to direct financial loss, regulatory penalty, and reputational damage (consequence)." Cause-event-consequence structures in workshops generate clarity and repeatability that vague risk labels cannot provide.
Once risks are identified, the analysis phase assigns likelihood and impact scores. The standard approach for a step by step risk analysis follows this sequence:
- Assign a likelihood score on your defined scale (e.g., 1 to 5) based on historical frequency, control environment, and expert judgment.
- Assign an impact score on the same scale across relevant dimensions: financial loss, regulatory exposure, operational disruption, and reputational damage.
- Multiply the two scores to generate a composite risk rating.
- Plot results on a probability-impact matrix to produce a visual heat map showing concentration of high-rated risks.
- Compile all entries into a ranked risk register, ordered by composite score.
| Factor | Qualitative analysis | Quantitative analysis |
|---|---|---|
| Primary method | Probability-impact matrix, workshops, expert panels | Monte Carlo simulation, value-at-risk models, loss distribution |
| Data requirements | Moderate; relies on structured judgment | High; requires historical loss data, distributional assumptions |
| Output | Risk heat map, ranked register | Probabilistic loss ranges, confidence intervals |
| Best applied to | All risks, especially emerging or novel ones | High-priority risks with sufficient historical data |
| Time and cost | Lower | Significantly higher |
| Use in financial institutions | Universal first pass | Credit risk modeling, market risk, capital adequacy |
Qualitative scoring using probability-impact matrices should always come first. Quantitative analysis is then applied selectively to higher-priority risks where the data exists to support it. For operational risk, Monte Carlo simulations can quantify aggregate exposure and help determine capital reserves, but they require clean loss event histories that many community banks and credit unions are still building.
Pro Tip: When running identification workshops, use anonymous pre-workshop surveys to surface risks participants may hesitate to raise in group settings, particularly those involving internal control failures or management oversight gaps.
Risk evaluation and treatment decisions
Scoring risks produces a ranked list. Evaluation decides which risks demand a response and what form that response takes. This is where your pre-defined risk appetite and tolerance thresholds become operationally critical. Risks above the tolerance threshold require treatment. Risks below it may be accepted with documentation.
The four treatment options for any identified risk are:
- Avoidance: Discontinue the activity generating the risk entirely. Applicable when the risk-return profile is consistently negative.
- Mitigation: Implement controls to reduce likelihood, impact, or both. The most common treatment in financial institution risk programs.
- Transfer: Shift financial consequence to a third party through insurance, contractual indemnification, or securitization structures.
- Acceptance: Formally acknowledge the residual risk and document the decision when it falls within appetite or when the cost of control exceeds the potential loss.
Mitigation decisions should follow a hierarchy of controls. In the financial institution context, that hierarchy moves from structural changes to processes and systems (the most durable controls) down to manual procedures and monitoring (the most dependent on human reliability). Eliminating a risky product entirely outranks adding an approval step, which outranks adding a compensating monitoring report.
Treatment plans only generate value when they specify who owns each action, what the completion deadline is, and what the estimated cost of implementation is. Board-ready reports attach priced timelines and RACI assignments to every treatment step so governance bodies can authorize funding and hold owners accountable.

Prioritization among competing treatments is a resource allocation problem. Risk scores provide the ranking, but practical factors including regulatory deadlines, implementation dependencies, and available budget all shape the final sequence. Credit risk controls tied to upcoming examination cycles, for example, typically take precedence over longer-term operational improvements even when the latter carry a higher risk score in isolation.
Pro Tip: Build a separate "accepted risk log" alongside your treatment register. Regulators want to see that acceptance decisions were deliberate, documented, and reviewed at a defined cadence. An informal mental note is not a governance artifact.
Documentation, reporting, and ongoing review
A well-executed assessment with inadequate documentation delivers only a fraction of its potential value. Regulators, auditors, and boards all require evidence of process, not just conclusions. The OSHA five-stage structure explicitly includes recording findings and scheduling reviews as formal stages, not optional follow-up, and that logic translates directly to financial institution risk governance.
Effective documentation captures:
- The scope statement and risk criteria established at the outset
- The complete risk register with cause-event-consequence entries, scores, and residual ratings
- Treatment decisions with ownership, timelines, and cost estimates
- The accepted risk log with documented rationale
- Meeting records and workshop outputs showing the evidence base for scoring decisions
Board reporting requires a different format than the operational risk register. Executives and directors need risk report summaries that lead with material exposures, show trend direction compared to prior periods, and translate risk scores into business language: potential financial impact, regulatory consequence, or strategic constraint. Heat maps work well visually, but they must be accompanied by narrative that explains movement, not just current position.
Scheduling formal reviews should be tied to both calendar triggers and event triggers. Annual or semi-annual reviews cover routine reassessment. Event triggers should include major regulatory changes, significant operational incidents, new product launches, material changes to the loan portfolio, or M&A activity. Integrating these triggers into your governance calendar prevents reassessment from slipping until the next examination cycle. The assessment process only generates lasting value when it operates as a continuous cycle, with real-time monitoring feeding back into identification and scoring between formal reviews.
What most risk assessments get wrong
I've reviewed risk programs across community banks, credit unions, and specialty lenders, and the failure pattern is remarkably consistent. The methodology is technically sound. The scoring is defensible. The register is formatted correctly. But the assessment sits in a SharePoint folder and influences almost nothing.
The root cause is that most institutions treat a risk assessment as a compliance deliverable rather than a management tool. The moment it satisfies an examiner or passes an internal audit, the energy behind it evaporates. Nobody owns the treatment timelines. The accepted risk log never gets reviewed. The next assessment starts from scratch twelve months later.
What I've found actually works is treating the risk register as a living operational document reviewed in every risk committee meeting, with color-coded status tracking on each treatment action. When business unit leaders see their items flagged as overdue in front of the CRO, the assessment becomes real. That accountability structure matters more than the sophistication of your scoring methodology.
The other consistent gap is the separation between qualitative and quantitative data streams. Mature operational risk programs combine scenario analysis, historical loss data, and leading indicators into a unified risk picture. Most institutions use one or the other and wonder why their assessments keep missing the same risks. Qualitative judgment without loss data overweights perception. Loss data without scenario analysis misses tail risks entirely.
Technology is closing this gap faster than most practitioners realize. AI-driven platforms can now surface emerging risk patterns from transaction data, flag control failures in near real time, and generate draft risk entries that your team refines rather than creates from scratch. The automation of risk workflows doesn't replace analyst judgment. It removes the administrative burden that keeps analysts from applying that judgment where it matters most.
— Raj
How Riskinmind transforms the risk assessment process
Financial institutions spend significant analyst hours on tasks that technology can handle: aggregating data, scoring risks against criteria, formatting registers, and generating board reports. Riskinmind's AI-powered platform is built specifically to reduce that administrative load while improving the accuracy and timeliness of the outputs your governance process depends on.
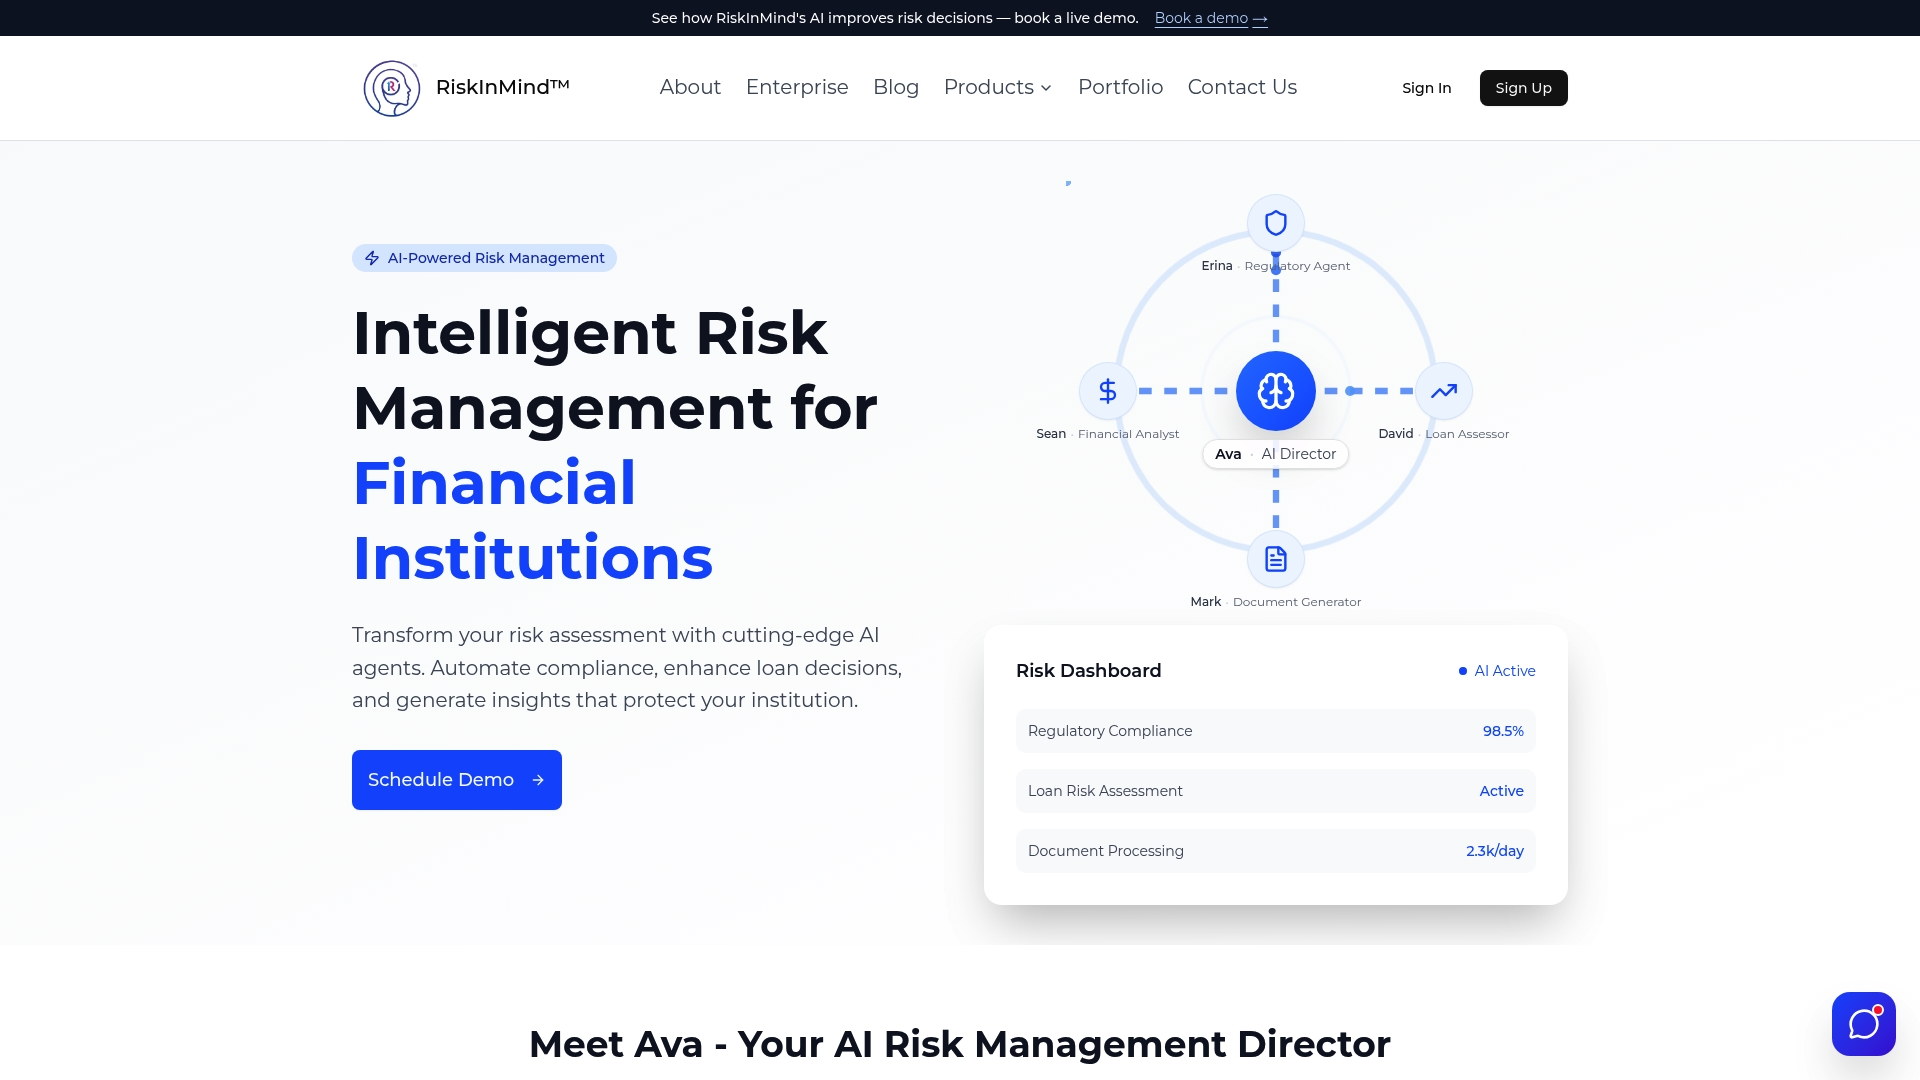
Riskinmind's specialized AI agents handle credit risk assessment, regulatory compliance monitoring, and market analysis concurrently, with results delivered in under half a second through SOC 2® certified infrastructure. The platform's risk dashboards provide real-time visibility into portfolio exposure and control status, replacing the static spreadsheets that make ongoing review impractical. For institutions ready to move from periodic assessment cycles to continuous risk intelligence, Riskinmind offers a purpose-built environment designed around how credit unions, community banks, and lenders actually operate. Explore the full platform at riskinmind.ai and see what a genuinely automated risk management process looks like in practice.
FAQ
What are the key steps in a risk assessment?
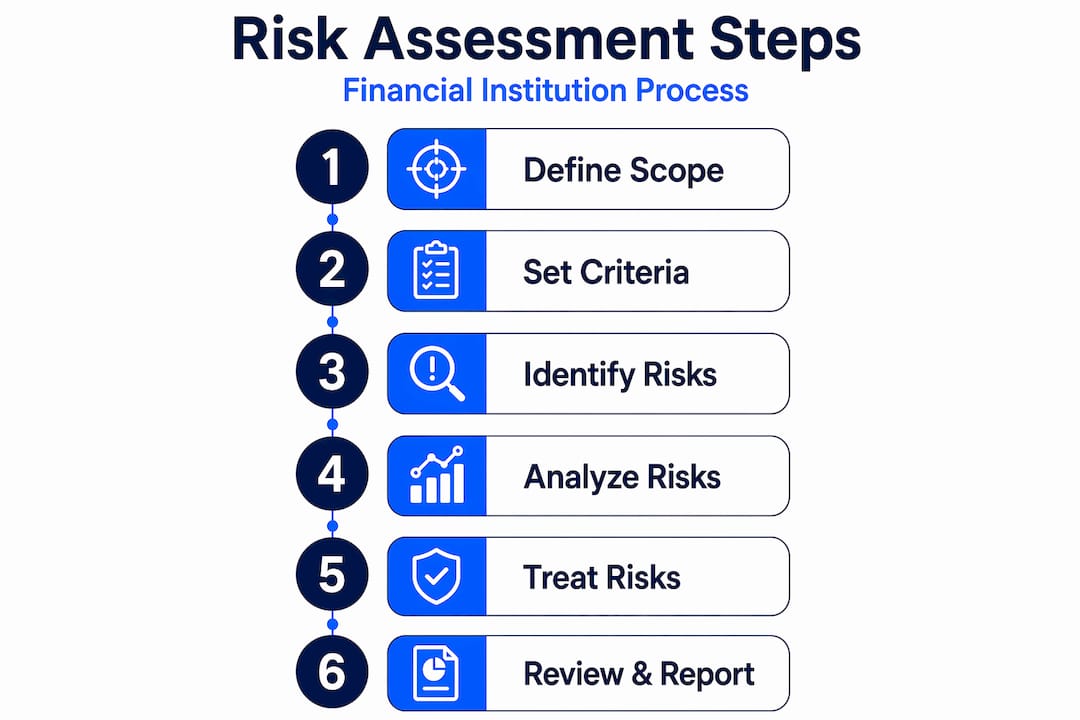
A structured risk evaluation follows these stages: define scope and risk criteria, identify threats using cause-event-consequence framing, score likelihood and impact, evaluate against risk appetite, select treatments, document findings, and schedule ongoing review. The ISO 31000 framework treats this as an iterative cycle rather than a linear project.
When should qualitative vs. quantitative analysis be used?
Qualitative probability-impact scoring should be applied to all identified risks as the standard first pass. Quantitative methods such as Monte Carlo simulation are then applied selectively to high-priority risks where sufficient historical loss data exists to support reliable modeling.
How often should a financial institution reassess risks?
Most institutions conduct formal reviews annually or semi-annually, but event-based triggers matter equally. Material regulatory changes, significant operational incidents, new product lines, and major portfolio shifts should all prompt reassessment outside the scheduled cycle.
What makes a risk register operationally useful?
A risk register generates operational value when each entry includes a cause-event-consequence structure, a composite risk score, a named treatment owner, a completion deadline, and an estimated implementation cost. Vague risk labels and unassigned treatments produce registers that satisfy auditors but change nothing.
How does AI improve the risk assessment process for financial institutions?
AI platforms accelerate data aggregation, risk pattern detection, and report generation while reducing manual scoring errors. Combining multiple data lenses including scenario analysis, transaction data, and leading indicators gives institutions a fuller risk picture than any single methodology can provide alone.