
How RiskInMind's Peer Benchmarking turns raw NCUA data into a competitive intelligence advantage — in seconds.
Every credit union leader has been in this meeting: the board wants to know how the institution stacks up against peers, the CFO pulls up a spreadsheet, someone questions whether the comparison group is even relevant, and two hours later the room has more questions than answers.
The problem isn't a lack of data. The NCUA publishes call report data for every federally insured credit union in the country. The problem is that raw data without context is just noise — and turning that noise into a clear picture of your competitive position has historically required either a dedicated analyst or an expensive consulting engagement.
RiskInMind's Peer Benchmarking changes that equation entirely.
What Peer Benchmarking Actually Means
Not all credit unions are peers. A $50M community CU in rural Montana and a $900M urban federal CU are both credit unions — but comparing their metrics side by side tells you nothing useful.
True peer benchmarking requires matching on three dimensions simultaneously:
- Asset size — institutions of comparable scale face comparable pressures
- Geography — state-level economic conditions, real estate markets, and regulatory environments matter
- Charter type — federal and state charters operate under different rule sets
RiskInMind does this automatically. Enter your credit union's name, hit Analyze, and within seconds you're benchmarked against a peer group that actually reflects your competitive environment.
A Real Example: Credit Union of New Jersey
Let's walk through what this looks like in practice.
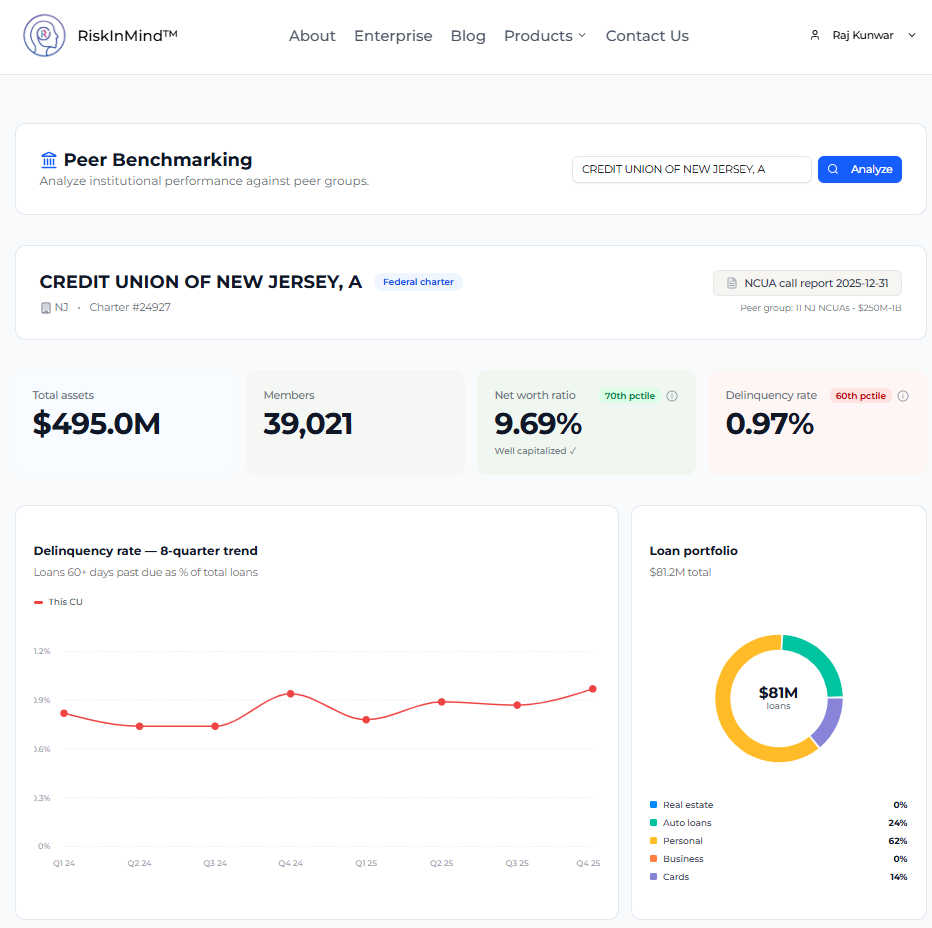
Credit Union of New Jersey, A is a $495M federal charter institution headquartered in NJ, serving 39,021 members. When analyzed through RiskInMind, the platform automatically identifies 11 NJ-based NCU peers in the $250M–$1B asset range — the institutions that genuinely compete in the same market, face the same economic conditions, and operate under the same regulatory framework.
The result isn't a data dump. It's a complete institutional performance profile.
The Metric Scoreboard: Four Numbers That Matter
RiskInMind surfaces four key metrics and, critically, tells you exactly where you stand relative to your peers:
| Metric | Value | Peer Rank | Signal |
|---|---|---|---|
| Net Worth Ratio | 9.69% | 70th percentile | Well Capitalized |
| Loan-to-Asset Ratio | 79.69% | 100th percentile | Top lender in peer group |
| Net Charge-Off Rate | 1.19% | 90th percentile | Warrants monitoring |
| Delinquency Rate | 0.97% | 60th percentile | Above peer median |
These aren't just numbers — they're a story. This credit union is deploying capital aggressively (100th percentile on loan-to-asset ratio), maintaining strong capital buffers (70th percentile net worth), but showing elevated charge-offs that deserve attention. That's a nuanced picture that no single metric could convey on its own.
A note on how to read percentile ranks: For capital metrics, higher percentiles indicate stronger performance. For delinquency and charge-offs, lower percentiles mean better asset quality. RiskInMind makes this explicit — no guessing which direction is "good."
AI-Generated Risk Insights: Your Always-On Analyst
After benchmarking, RiskInMind doesn't just hand you a scorecard and walk away. The platform's AI generates a plain-language risk briefing across four dimensions:
Delinquency Elevation
The credit union's delinquency rate of 0.97% places it in the 60th percentile — higher than 60% of its peers. While not critically high, this position identifies a clear area where targeted improvement could move the needle on asset quality.
Capital Strength
With a 9.69% capital ratio at the 70th percentile, this institution demonstrates robust capital strength relative to its peer group. That buffer isn't just a regulatory checkbox — it's a competitive advantage that supports future growth initiatives and absorbs potential losses.
Portfolio Concentration
A loan-to-asset ratio of 79.69% at the 100th percentile means this credit union is deploying assets more aggressively into loans than every other institution in its peer group. Efficient capital deployment — but a concentration worth monitoring as credit conditions evolve.
Regulatory Preparation
The net charge-off rate of 1.19% sits at the 90th percentile, meaning 90% of peers have a lower charge-off rate. This elevated rate is the kind of signal that draws examiner attention — knowing this in advance gives leadership time to address underwriting practices before the next exam cycle.
Trajectory Matters: 8-Quarter Trend Analysis
A single data point is a snapshot. Eight quarters of data is a story.
RiskInMind plots your key metrics across two full years of rolling data, so you can see not just where you are today but where you're heading. For Credit Union of New Jersey, the delinquency trend shows relative stability in the 0.75–1.0% range through 2024, with a modest uptick into Q4 2025 — the kind of early signal that's easy to miss in a point-in-time analysis but becomes visible the moment you plot the trajectory.
Strategic decisions — loan policy changes, reserve adjustments, collection enhancements — require knowing whether a metric is trending up, down, or holding steady. RiskInMind makes that visible instantly.
Loan Portfolio Visibility
Understanding concentration risk means knowing your loan mix, not just your totals. For this credit union's $81.2M loan portfolio:
| Segment | Share |
|---|---|
| Personal Loans | 62% |
| Auto Loans | 24% |
| Cards | 14% |
| Real Estate | 0% |
| Business | 0% |
A 62% concentration in personal loans with zero real estate exposure is a specific risk profile — one that behaves very differently in a rising-rate environment than a portfolio with heavy real estate. RiskInMind surfaces this visually alongside peer comparisons, so you can immediately identify whether your concentration is an outlier or industry-standard for your peer group.
Who This Is Built For
| Role | What You Walk Away With |
|---|---|
| CEO / President | Board-ready benchmarking narrative in under five minutes |
| CFO | Capital and efficiency ratios contextualized against true peers |
| Chief Risk Officer | AI-powered early warning system for emerging risk signals |
| Board Members | NCUA data made legible — without needing to be an analyst |
| Compliance Teams | Regulatory posture mapped to peer context before the examiner arrives |
Why This Is Different
Most credit union analytics tools give you dashboards. RiskInMind gives you context.
The difference is the peer group. Generic industry averages tell you how you compare to thousands of institutions that share nothing in common with yours. RiskInMind's peer matching — by asset size, state, and charter type — means every percentile rank you see reflects institutions that genuinely compete in your market.
Add the AI-generated narrative layer and you move from data to insight to action in a single workflow. No spreadsheets. No manual data pulls. No waiting on an analyst to synthesize the numbers.
Get Started — No Implementation Required
There's no IT project. No onboarding. No waiting. Credit union professionals are using RiskInMind today to benchmark their institutions against true peers using the most current NCUA call report data available.
Try Peer Benchmarking at riskinmind.ai →
Sign up takes less than a minute. Your first analysis takes less than thirty seconds. What you do with the insight is up to you.
RiskInMind is an AI-powered financial analytics platform built specifically for credit unions. Data sourced directly from NCUA call reports. SOC 2 certified.
*riskinmind.ai · © 2026 RiskInMind™